6. Revenue
There is considerable uncertainty in financial markets that have resulted in a marked increase in the rate of return since we met with our customers. This has resulted in our revenue forecast being 10 per cent above the 2019-24 period, higher than what we expected to present to customers. We note considerable uncertainty on the rate of return going forward, and this volatility will impact the revenue forecast we submit to the AER on 31 January 2023.
In its determination, the AER sets a cap on the annual revenue we can recover from customers through our network tariffs. The annual revenue is calculated based on the following elements:
- Investment costs associated with our regulatory asset base (RAB) which is the value of the stock of our assets at a point in time. The RAB comprises the depreciated value of our stock of assets, together with the forecast capital expenditure discussed in Chapter Five. The financing costs include a return on the RAB based on the current estimate of the rate of return, and depreciation of the RAB (often termed “return of” investment).
- Forecast operating expenditure for the upcoming regulatory period, as discussed in Chapter Six, together with an estimate of taxation costs.
- Adjustments to the revenue depending on our performance under the AER’s incentive schemes and amounts to fund new innovation.
The calculation of forecast revenue relies on the AER’s revenue model (Post tax revenue model) which includes the capital and expenditure forecasts discussed in the previous chapter together with inputs regarding the current value of our asset base and current market assumptions.
Revenue trends
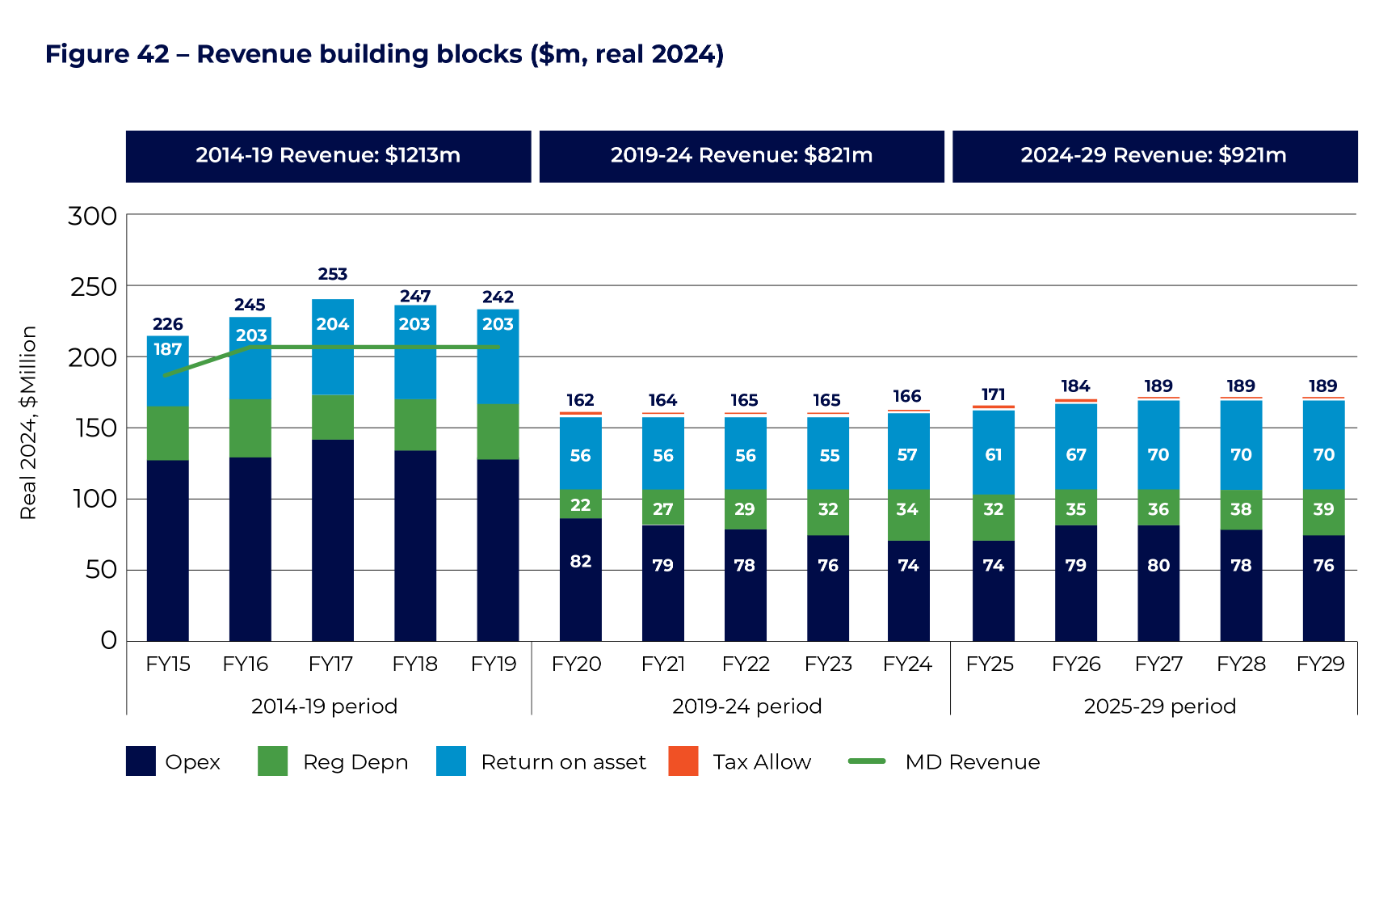
Figure 42 identifies our forecast revenue for 2024- 29 compared to the 2019-24 and 2014-19 regulatory periods. Our 2024-29 revenue is 10 per cent higher than the 2019-24 period, but still significantly below the allowance set by the jurisdictional regulator in 2014-19.
In the 2014-19 period, the jurisdictional regulator set a total revenue allowance of $1213 million due to high capital and operating expenditure together with high rates of return in the market conditions. A Ministerial Direction later required us to reduce our maximum revenue to closer to $1000 million.
Network revenue fell significantly in the first year of the 2019-24 period. The primary drivers were the AER’s decision to reduce our operating expenditure, and a low rate of return due to prevailing market conditions. Further, the opening regulatory asset base was re-visited under the national economic framework, which led to a reduction in the return on assets (depreciation).
The higher revenue in the 2024-29 period is primarily explained by higher rates of return on investment due to a recent change in market conditions. Other drivers include increasing capital expenditure, which has led to higher financing costs including depreciation. However, the reduction in forecast operating expenditure has helped keep revenue from rising further.
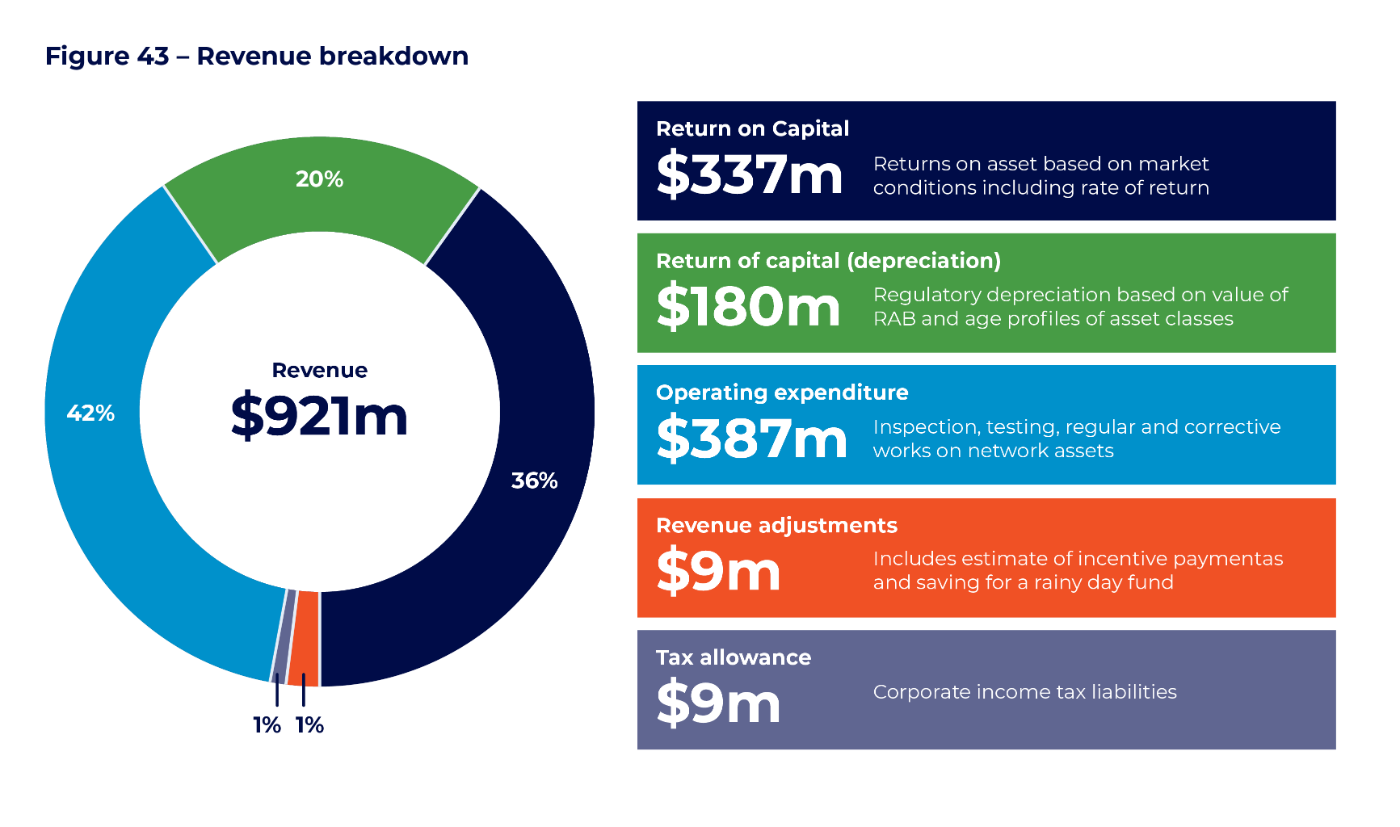
Figure 43 identifies the components of our revenue forecast for 2024-29. The return on and return of the RAB comprise our investment costs, and together drive 56 per cent of revenue. Operating expenditure and tax comprise about 43 per cent of revenue. Revenue adjustments account for only 1 per cent of revenue.
6.1 Overall approach to develop revenue forecast
In our April 2022 People's Panels sessions, we noted our expenditure plans at the time were resulting in materially higher revenue forecasts for the 2024-29 period compared to the 2019-24 period. Our customers supported our objective of using available levers to reduce revenue to similar levels to the 2019-24 period. We proceeded to implement levers to keep our revenue forecast for 2024-29 at similar levels to 2019-24 in real terms (excluding the impact of inflation). This included reducing capital expenditure based on risk prioritisation and delivery capabilities, aligning our overhead allocation to other networks resulting in more capitalisation of overheads, and implementing efficiency stretch targets for operating expenditure.
With this target in mind, we consulted customers on their preferences for higher expenditure on future network, replacement and customer service. Our customers signalled that they were comfortable with a small increase in revenue above 2019-24 levels to implement their preferred options.
More recently however, our expected financing costs for the 2024-29 period increased markedly due to higher interest rates and global events. These uncontrollable factors have led to an unexpected 10 per cent increase in our revenue forecast for 2024-29 compared to the 2019-24 period. Inflation has also risen significantly since April 2022, and this will add further cost of living pressures to our customers.
What levers are available to reduce revenue, and what are the risks?
A key question in this Draft Plan is the extent and availability of levers to bring down revenue, and the trade-offs that may arise in respect of short term risks and longer term sustainability.
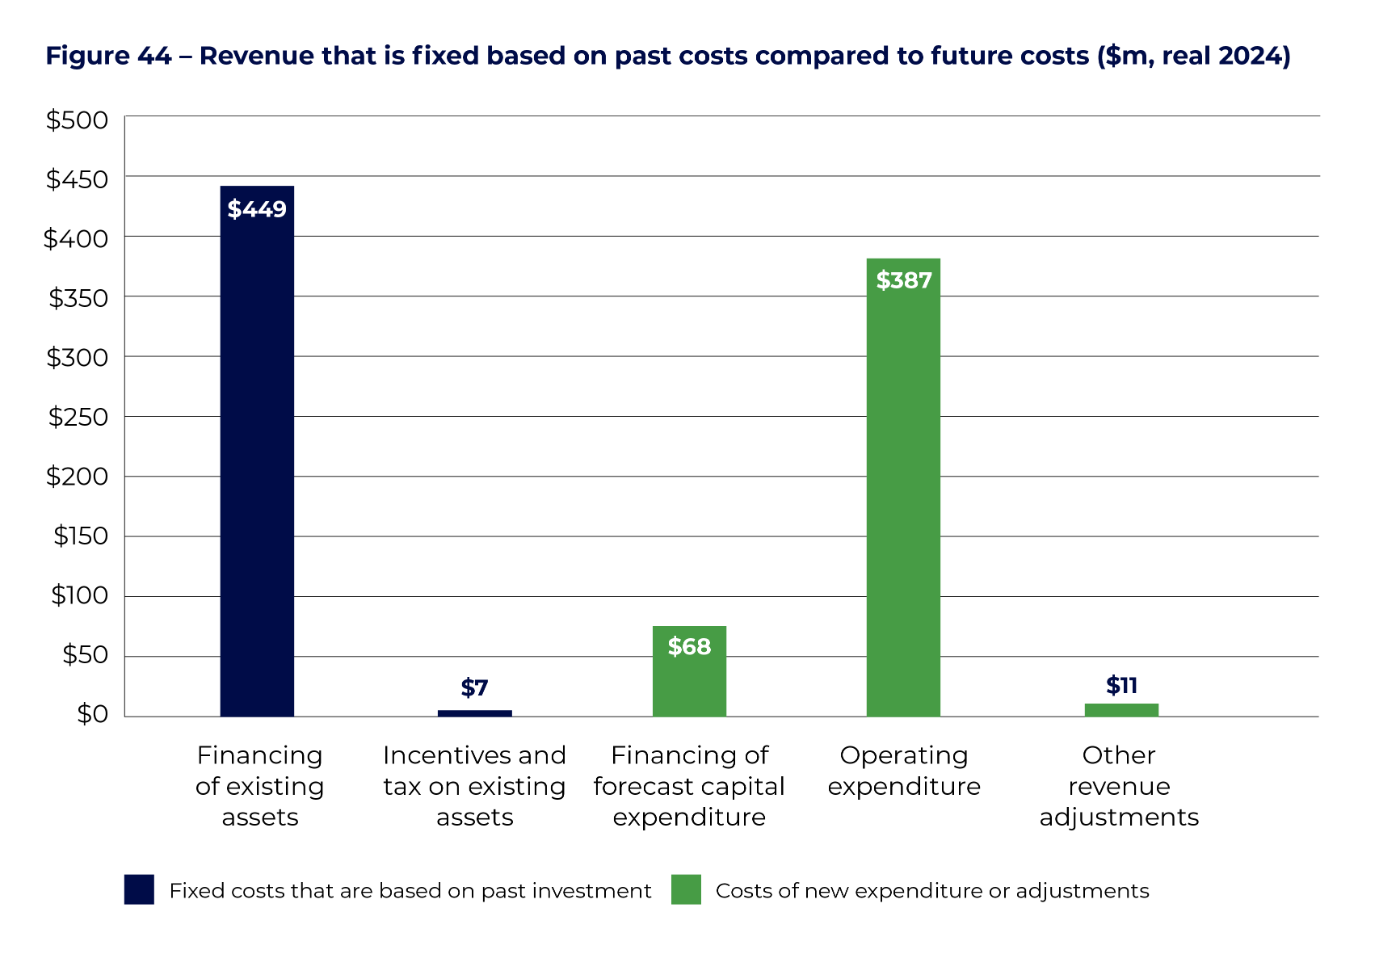
A key limitation is that a significant proportion of forecast revenue is fixed. For example, about 51 per cent of our forecast revenue for the 2024-29 period relates to the costs of financing previous investments in network and non-network assets, tax liabilities relating to past investment, and incentives for performance in this period. Only 49 per cent of forecast revenue is impacted by our forecast expenditure in the 2024-29 period. This can be seen in Figure 44.
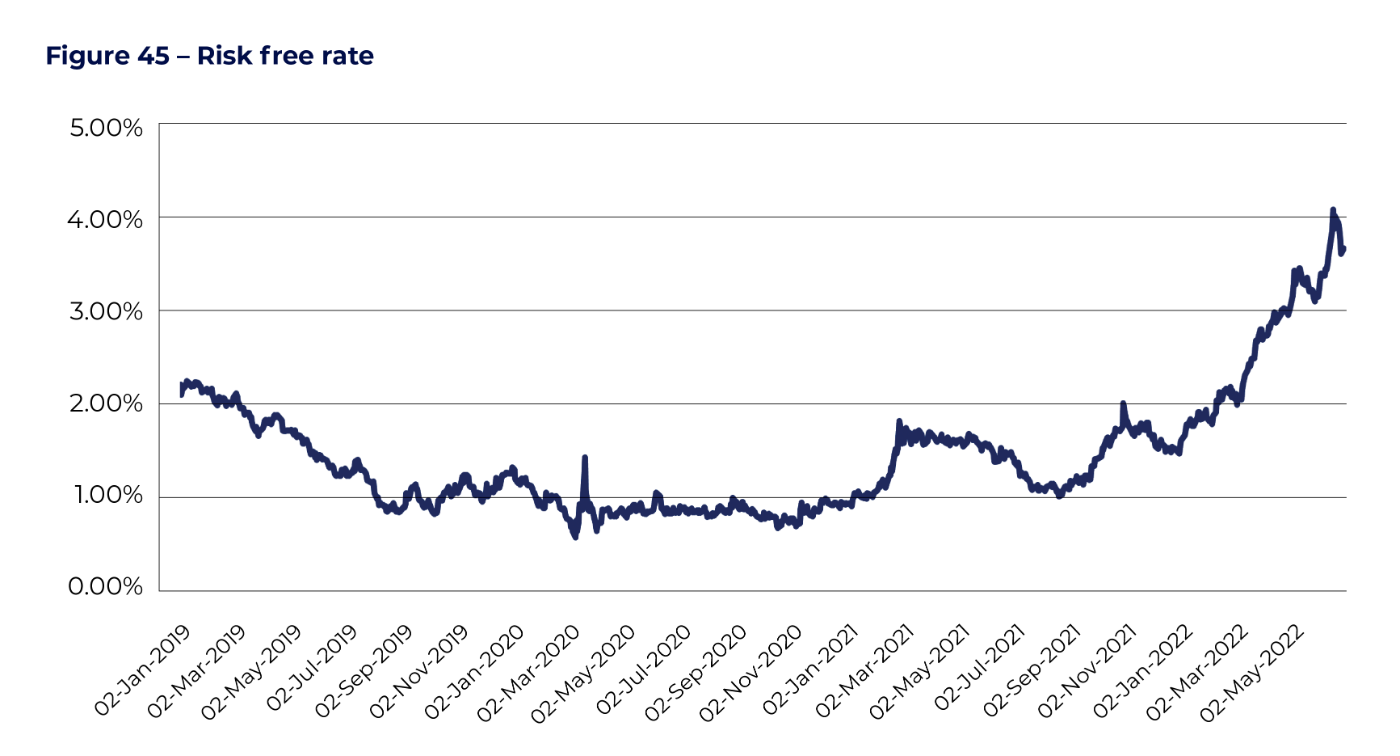
Further, the current financial market is highly volatile and in this environment it is difficult to provide customers with certainty that we can achieve revenues at 2019-24 levels. Under the AER’s calculations, the risk free rate is set in a period closer to the AER’s determination based on market observations. Our financing costs are highly sensitive to this parameter, and it is beyond our control to influence the rate. Figure 45 shows the recent volatility in the risk free rate with a significant increase since April 2022. This raises the issue of whether achieving a revenue neutral target is desirable or achievable.
Regardless, we understand that our customers require clear information on what elements of our future expenditure could be deferred or avoided, and the trade-offs that entails. We have identified five levers:
- Re-consideration of customer preferences which have added $29 million to revenue.
- Increasing our capitalisation of overheads beyond current levels. This would have the effect of reducing the pace of revenue recovery, but further consideration is required in relation to aligning with accounting standards.
- Deferring regulatory depreciation to future periods, noting that this will accentuate the pressures on rising electricity prices in the future.
- Further reductions in capital expenditure by taking on more short term risk and deferring ICT systems. This would have limited impact on reducing revenue. It would also mean that we take on more reliability, safety, and security risks in the 2024-29 period, together with building the conditions for a significant capital expenditure increase in future periods.
- Further reductions in operating expenditure beyond the efficiency stretch targets in our forecasts. This would require a reduction in the level and cost of core services we undertake. Similar to capital expenditure, this would result in higher risks in the 2024-29 period, given we have already sought to apply stretch targets and most of this expenditure is recurrent and required.
6.2 Returns on investment
About 56 per cent of our forecast revenue for the 2024-29 period relates to funding our past and future investments.
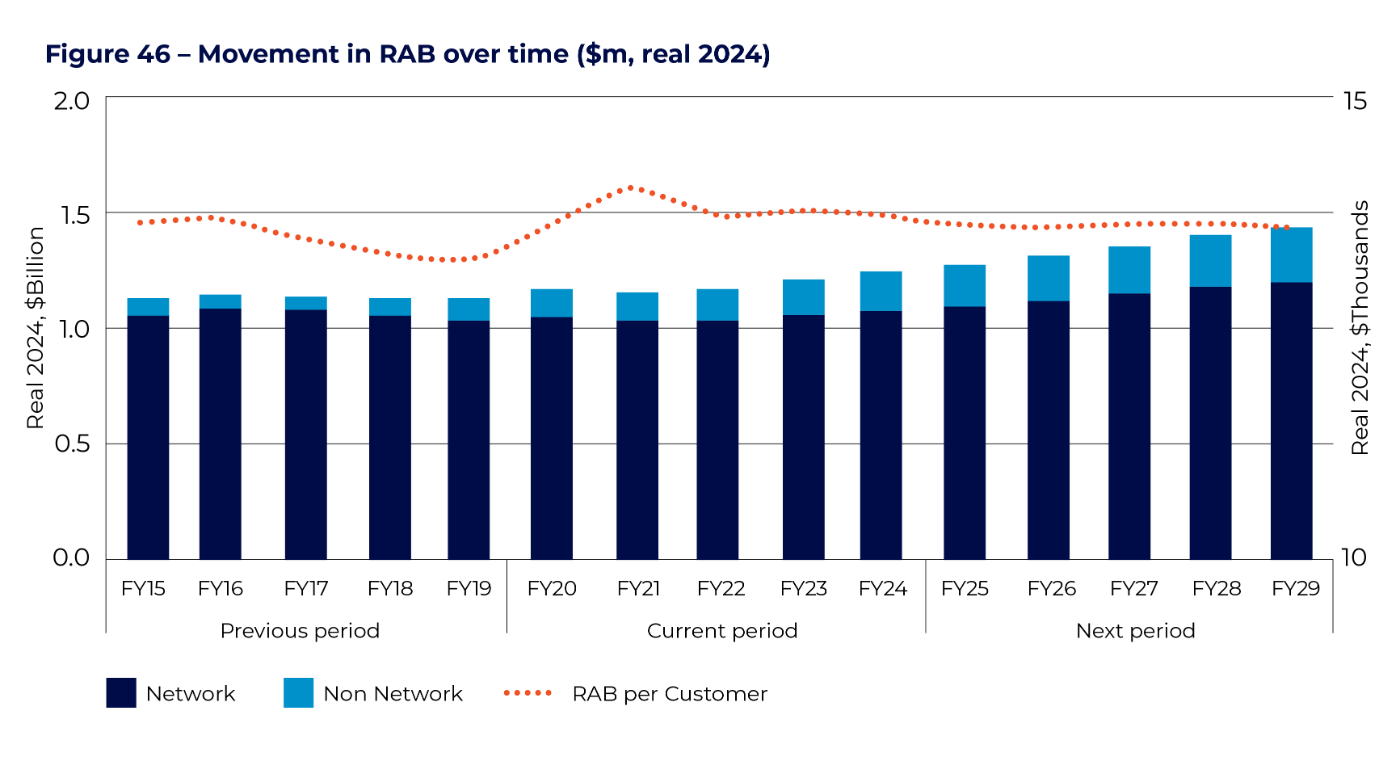
The calculation of financing costs is based on the value of the RAB and the remaining life of assets. The RAB is the sum of the depreciated value of past capital expenditure and forecast new capital expenditure. We make adjustments to the RAB to exclude capital contributions and asset disposals. The columns in Figure 46 shows the movement in our RAB over the previous, current and forecast period for our network and non-network assets. The green line shows that the RAB per customer will stay relatively constant in the forecast period.
We note the RAB is significantly less than our estimate of the replacement cost of assets of about $3 to $4 billion, indicating that the current asset base is highly depreciated. The movement in our RAB per customer largely reflects the increase in capital expenditure over the period being higher than depreciation on past capital expenditure. We expect this trend to continue as we invest in new assets and replace assets that are highly depreciated in the RAB.
Return on assets
The AER determines a return on investment allowance for each year of the regulatory period. The allowance is calculated by multiplying the nominal rate of return by the nominal value of the RAB. The rate of return represents the expected rate of financing required to finance a benchmark efficient business facing similar risk. The nominal vanilla weighted average cost of capital is the proportion of the return on equity and return on debt based on a defined gearing ratio.
Rate of return parameters and values are largely pre-determined through the application of the AER’s Rate of Return Instrument, but in some cases are based on market data either at the time of the determination or through updated data in the regulatory period.
A key change to the calculation of the rate of return has been the sudden increase in the risk free rate, which has a consequential impact on the return of equity. The risk free rate has increased significantly since our consultations with customers in April 2022 due to higher interest rates and other global factors. The risk free rate will be calculated closer to the time of our determination over an averaging period, and is then likely to be locked in for the duration of the 2024-29 period. We will continue to advise stakeholders on updates, but note that this is an uncontrollable factor influencing our overarching objective of maintaining revenues in the 2024-29 period at levels similar to 2019-24.
A further change that has impacted our calculation of the rate of return has been the AER’s draft decision on the 2022 Rate of Return instrument. Once final, this will be a binding instrument that will be applied in our regulatory determination for the 2024-29 period. The AER’s draft decision includes increasing the market risk premium which has the effect of increasing the return on equity. However, the AER will be using a five-year risk free rate period, which will likely lead to lower estimates of the return on equity.
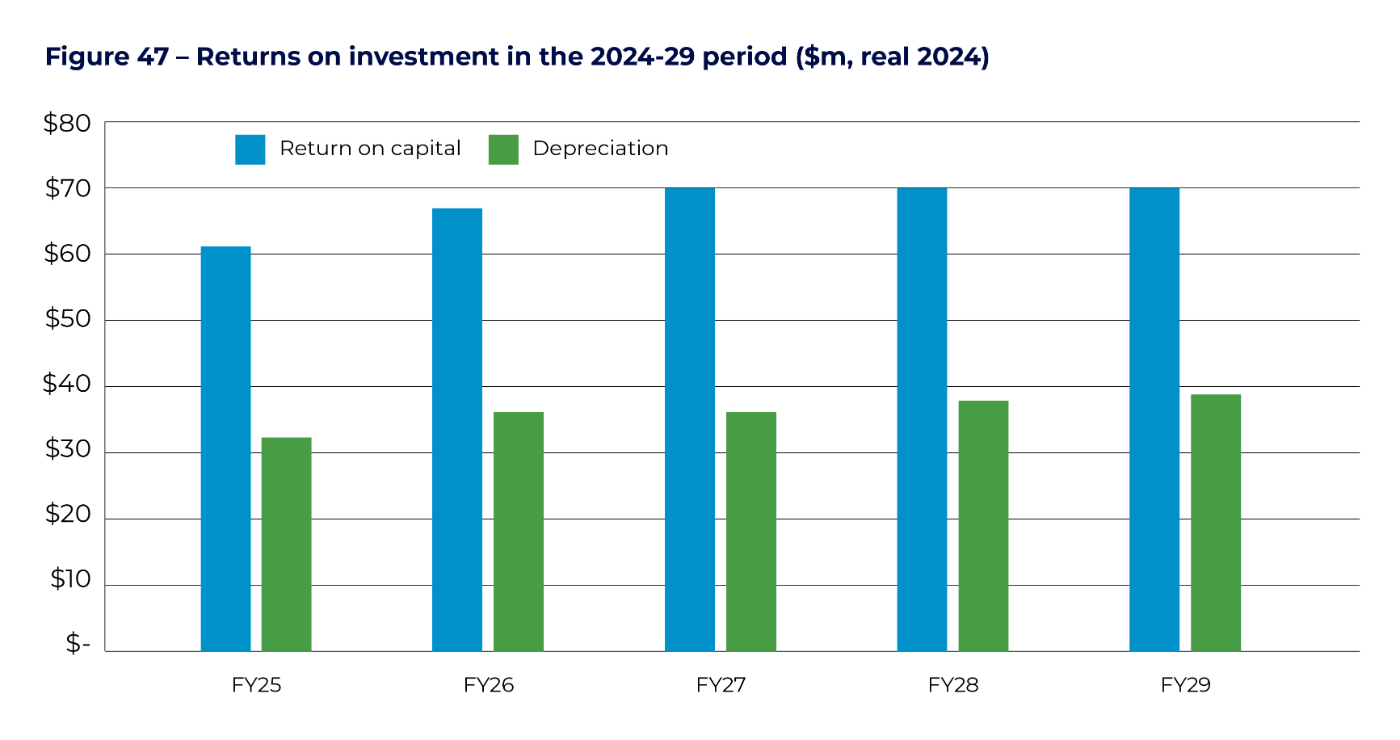
Return of assets (depreciation)
We recover a revenue allowance equal to the depreciation returns calculated in the AER’s revenue models. The depreciation included in the revenue allowance is net of assumed indexation. Straight line depreciation of existing assets as at 30 June 2024 is calculated using the AER’s depreciation model, which applies the year-on-year tracking method. Straight line depreciation on new assets forecast for the 2024–29 period is calculated within the AER’s Post Tax Revenue Model using the same method. In both cases, we have retained the asset classes and standard lives adopted by the AER for the 2019–24 period.
Figure 47 identifies the returns on and of assets.
6.3 Other revenue items
About 37 per cent of the forecast revenue relates to operating expenditure forecasts. These forecasts were set out in Chapter Five of this Draft Plan and account for $387 million of forecast revenue in the 2024-29 period. As operating expenditure is an annual cost that is unrelated to an asset, the cost is passed through directly as a revenue item.
Like other businesses, we must pay income tax to the government. The allowance for tax costs in our building block proposal reflects our expected tax liabilities over the next regulatory period. We have forecast this allowance using the AER's revenue model as seen in Table 4.
Table 4 - Corporate income tax ($m, real 2024)
| FY25 | FY26 | FY27 | FY28 | FY28 | Total | |
|---|---|---|---|---|---|---|
| Estimated cost of corporate income tax | 2.9 | 1.9 | 1.1 | 1.1 | 2.0 | 9.0 |
As well as shared asset revenue, our building blocks revenue is also adjusted for any incentive allowances. These can be positive or negative and are intended to give effect to schemes applied by the AER to ensure equal sharing of benefits from efficiency improvements over the period.
For the 2024–29 period, our proposed revenue includes two incentive allowances:
- CESS carryover amounts – these result from applying the AER’s capital expenditure sharing scheme to our actual capex incurred over the 2019–24 period
- DMIA – this is an ex ante allowance for demand management innovation.
We have also included an adjustment to implement the customers' preferences for 'saving for a rainy day' fund of $9.1 million.
Adjustments to revenues for these additional allowances appear in Table 5.
Table 5 - Other revenue adjustments ($m, real 2024)
| FY25 | FY26 | FY27 | FY28 | FY28 | Total | |
|---|---|---|---|---|---|---|
| CESS carryover amounts | (0.5) | (0.5) | (0.5) | (0.5) | (0.5) | (2.4) |
| DMIA | 0.38 | 0.38 | 0.38 | 0.38 | 0.39 | 1.9 |
| Saving for a Rainy Day Fund | 1.76 | 1.77 | 1.80 | 1.85 | 1.91 | 9.1 |
| Total adjustments | 1.6 | 1.7 | 1.7 | 1.7 | 1.8 | 8.6 |
The AER may adjust revenues for benefits we and our customers receive from shared assets over the current regulatory period. The small number of assets we currently use to provide both regulated services and unregulated services do not generate sufficient revenue at this stage for the AER to make any adjustment. We will revisit this issue prior to submitting our regulatory proposal in January 2023.
6.4 Typical customer impacts
In our conversations with customers, we have been discussing the complexity of translating the impact of a change in network revenue in 2024-29 to a customer’s electricity bill.
Similar to other states and territories in Australia, a customer’s electricity bill is issued by their retailer. The bill reflects the customer’s share of the total cost of supplying energy including generation of electricity, the use of our transmission and distribution network, the retailer margin, and the costs of managing the power system and market operating costs as seen in Figure 48.
In the NT, the NTG provides a subsidy for smaller customers through the Pricing Order that reduces their electricity bill. This means that the tariffs in a customer’s bill do not relate to the relative costs of each sector, making it complex to specify the relative contribution of our costs. In our conversations with customers we have noted that in Australia, network costs account for 40 to 45 per cent of the electricity bill.
An increase in our network revenue in the 2024-29 period would increase the total cost of electricity in the NT. The extent to which this is passed on to customers depends on how the NTG Pricing Order will change in the 2024-29 period. However, for discussions on affordability with customers we have assumed that an increase in our network revenue would be fully reflected in a customer’s bill.
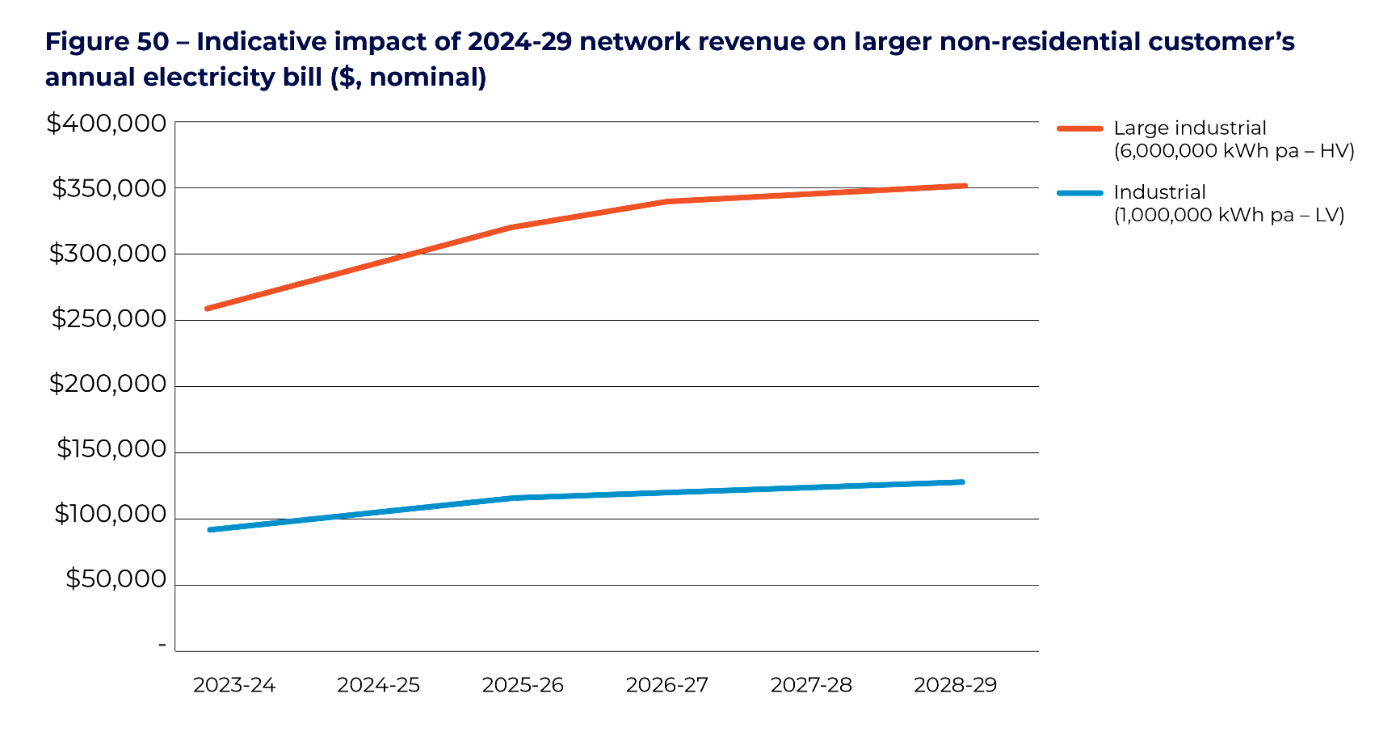
For larger customers, it is more probable that an increase in our network revenue would be passed through by the retailer, although this will depend on the specific tariffs of the retailer.
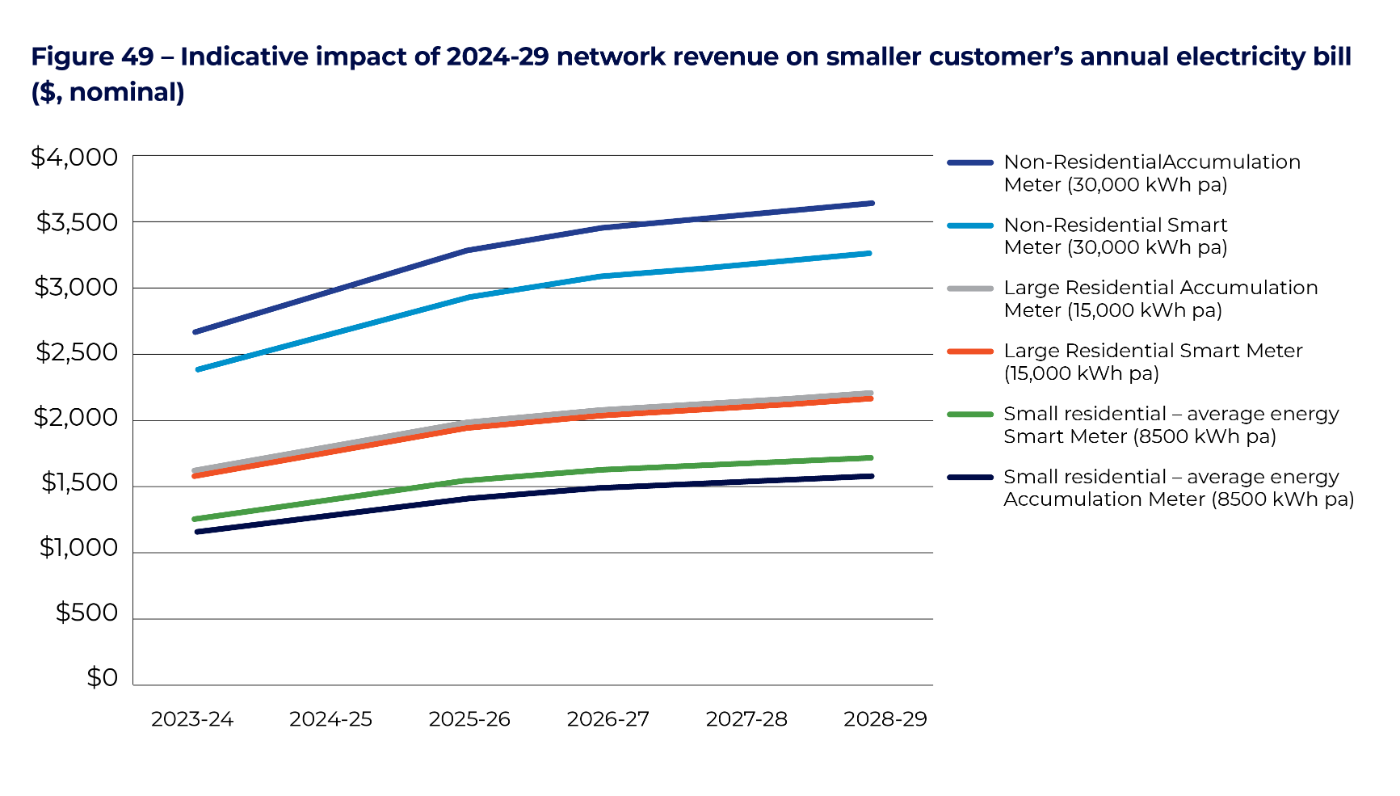
For the purposes of this Draft Plan, we have assumed that the annual change in smoothed revenue will have a direct impact on each of our “typical customers” in each tariff class. As noted in Chapter Nine, we are also seeking feedback on making changes to our tariff structures. This may mean that there are likely to be differences between our customers on how the increase in network revenue is shared among customers. We have yet to fully undertake this analysis and will provide stakeholders with information in our engagement sessions and our regulatory proposal. The analysis also does not take into account the changes in customers, energy and demand that also have an impact on electricity bills.
Figure 49 identifies the indicative bill impact from the 5-year plans presented in this Draft Plan for our typical smaller and medium sized residential and non-residential customers. Figure 50 identifies the indicative bill impact for our industrial and large industrial major customers.
Figure 48 - Typical electricity bill breakdown