5. Operating expenditure
We forecast a 13 per cent decrease in operating expenditure in the 2024-29 regulatory period compared to the 2019-24 current period. The lower expenditure primarily relates to improvements in our measurement of underlying labour costs comprising our operating activities. This has resulted in more overhead costs being allocated to capital expenditure in accordance with our approved cost allocation method and in line with the practices of other networks. Our lower level of operating expenditure incorporates an efficiency stretch target and step changes relating to our customer preferences for future network programs and customer service improvements.
Operating expenditure (opex) relates to regular annual expenses. These costs are recovered from customers by Power and Water on a yearly basis.
As noted in section 1.4, there are three broad categories of opex:
- Network opex – includes maintenance of assets, emergency response costs, and vegetation management.
- Non-network opex – relates to expenditure on maintaining and operating ICT assets, corporate property assets and fleet assets.
- Overhead opex – relates to the share of network and corporate overheads that are allocated to operating expenditure in accordance with accounting standards and the AER approved cost allocation methodology.
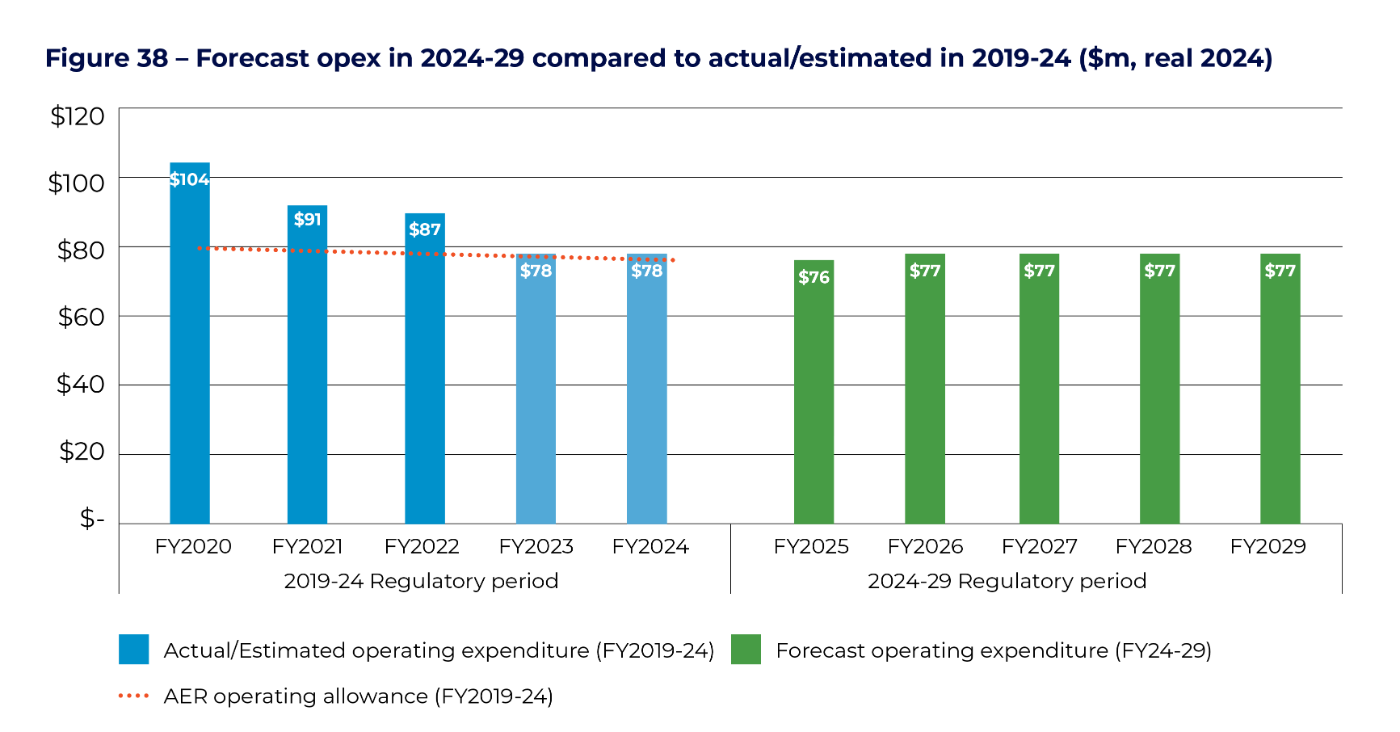
Figure 38 compares our forecast operating expenditure for the 2024-29 regulatory period to actuals and estimates for the current 2019-24 period and the AER’s allowance. The figure shows that while opex remained higher than the AER’s allowance at the start of the 2019-24 regulatory period, actual opex has been declining over the last two years and is expected to further decline by the end of the period. Our forecast opex (including debt raising costs) of $387 million for the 2024-29 regulatory period is 13 per cent lower than the AER’s allowance for the 2019-24 period.
This lower amount largely reflects changes in our accounting practices relating to the treatment of overheads to be more in line with standard industry practice. This allows for a more realistic comparison of our operating expenditure performance compared to peers and is more consistent with the efficient level of expenditure substituted by the AER in the last regulatory determination. We propose to include a staggered 10 per cent efficiency stretch target on our opex network and corporate overheads, reflecting our ongoing commitment to delivering real and sustained reductions in our opex over time, as our business continues to mature and develop its understanding and capabilities under the NT NER.
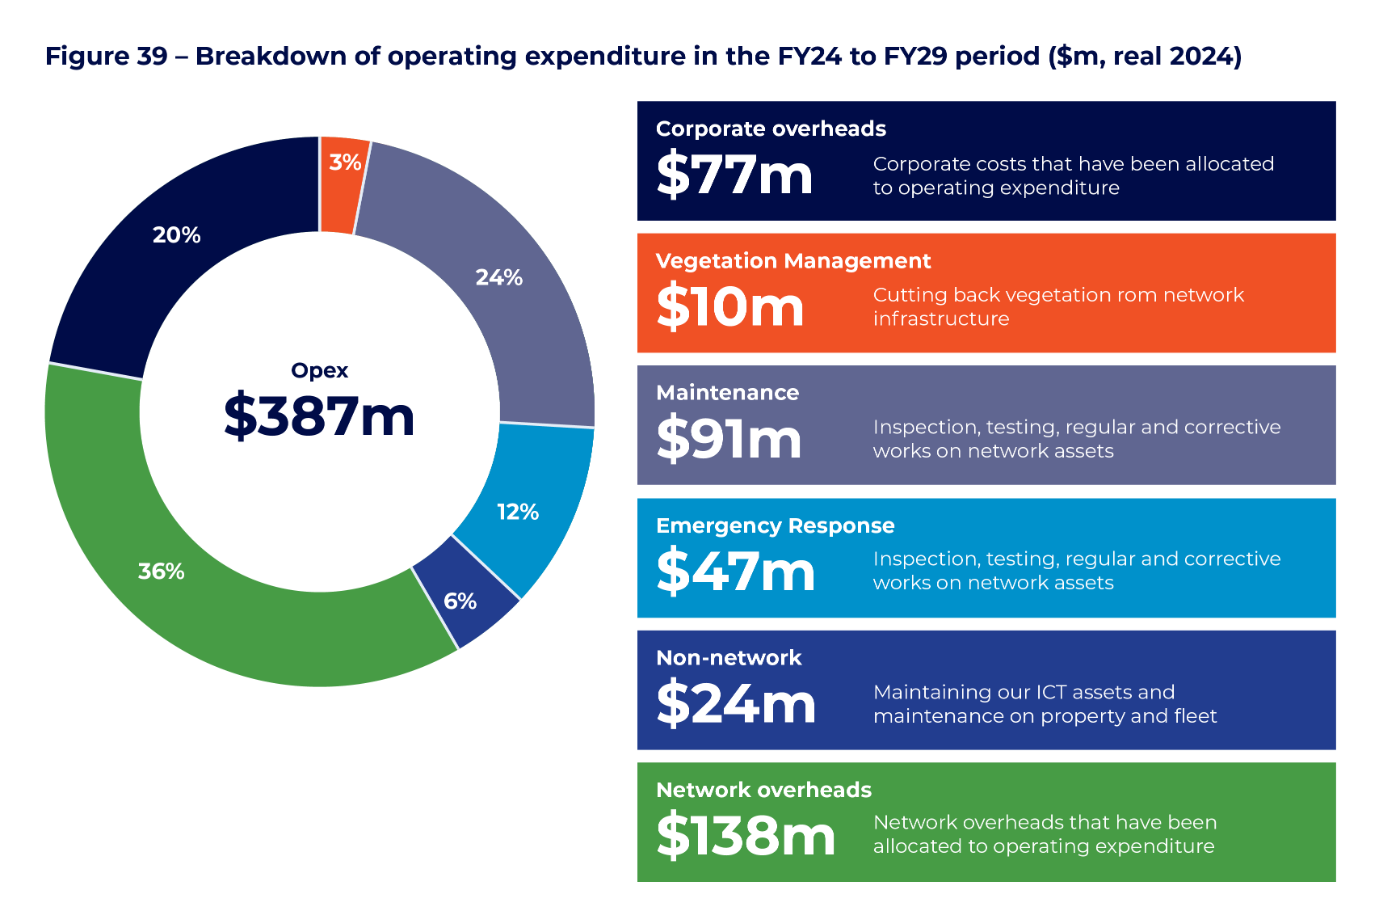
Figure 39 provides a breakdown of our operating expenditure for the 2024-29 regulatory period. It shows that our corporate and network overheads comprise a significant proportion of our forecast opex.
5.1 Forecast method for operating expenditure
We have applied the AER’s approach in its Expenditure Forecast Assessment Guidelines to calculate the operating expenditure for the 2024- 29 period. This is based on the base- trend- step method depicted in Figure 40 on the next page which consists of:
- Base Year – Operating expenditure tends to be recurrent from year to year. This means that most recent expenditure generally provides a good indication of future levels.
- Trend – Consistent with the AER’s approach we will apply a rate of change to the base year to account for changes in input prices, work activity from increasing network size, and productivity.
- Step changes – We will identify changes impacting our business environment that will change our costs. Consistent with the current period we will also add step changes for annual efficiency adjustments if required.
While we are adopting the AER’s preferred approach towards developing our operating expenditure forecasts, our application will differ slightly to other electricity networks. This is largely due to legacy issues associated with our existing systems ability to capture and report data and our unique operating circumstances. These factors make it difficult for Power and Water to be meaningfully compared to other peer networks. Other networks have significantly larger customer numbers to spread their costs across, operate interconnected networks over a much smaller geographical area than the Territory, and generally do not operate as the primary provider of both transmission and distribution services.
We have been working closely with the AER to explore options for how benchmarking could be applied in a meaningful way to Power and Water given the substantial differences that exist with our operating circumstances relative to our peers. Given the significant amount of work required to quantify appropriate operating environment factor adjustments, the AER has indicated that it will likely not apply econometric benchmarking for assessing our base year efficiency, and will instead rely on other top-down checks, such as category benchmarking and examining cost trends over time. This is consistent with the approach applied by the AER in our current regulatory determination.
In applying the AER’s mechanistic approach towards developing our operating expenditure forecasts, we have also sought to consider the ‘big picture’ of how our network will need to adapt to major changes impacting the energy industry, and internal drivers.
The key strategic drivers outlined in Chapter Three, coupled with our discussions with customers and stakeholders has significantly shaped and informed how we have developed our forecast operating needs for the 2024-29 period. Importantly, in preparing our forecasts we have sought to ensure that we have sufficient resources to efficiently realise customers’ vision for how our network should operate in the future.
Figure 40 - Operating expenditure Forecast Approach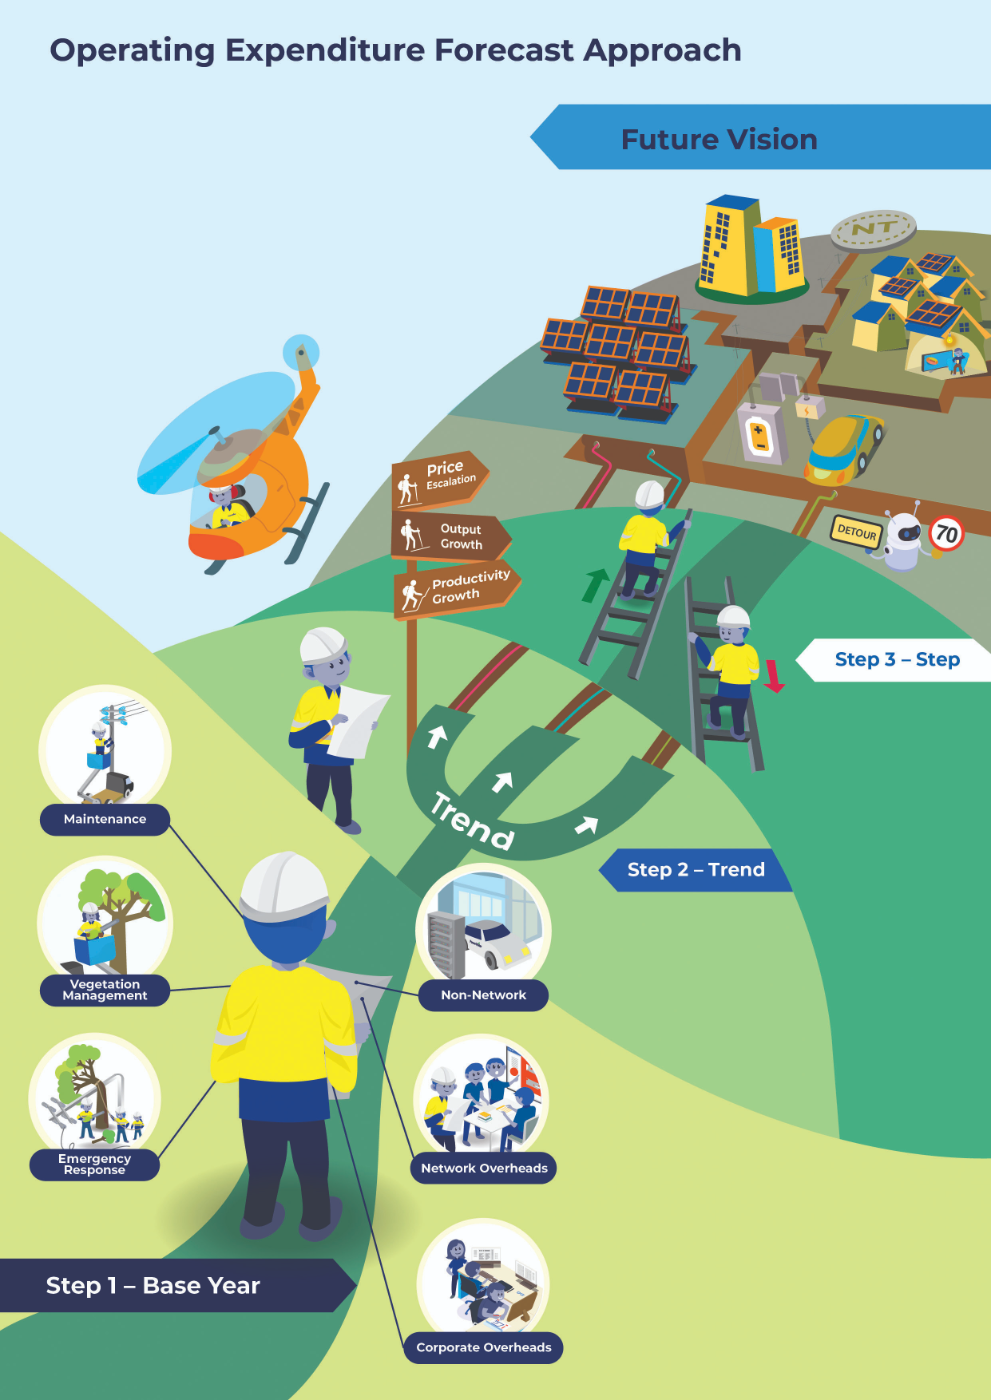
5.2 Drivers of change in operating expenditure - past to future
In seeking to understand the reasonableness and efficiency of our opex forecasts and our performance to date, it is necessary to take into account the circumstances in which Power and Water transitioned to the national electricity framework, and the significant change events which have since occurred.
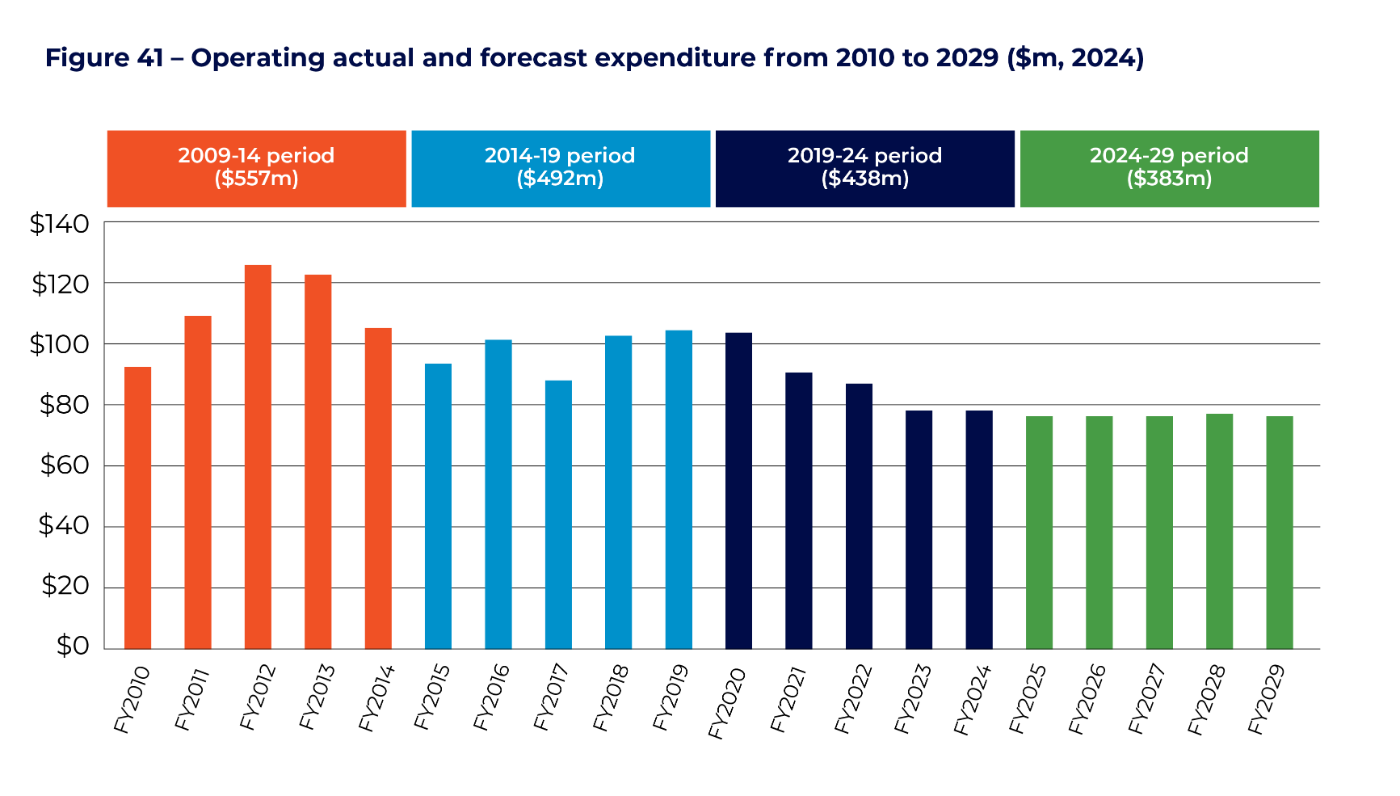
Figure 41 provides a long-term view of our operating performance and shows how our operating expenditure has reduced significantly over time from historical levels in 2010-2014. The following sections are intended to provide further context on our performance to date and explain some of the key change events which have impacted our operations resulting in a much longer transition to more efficient and sustainable levels of opex.
Understanding our operating expenditure target and performance to date
Power and Water joined the national electricity framework on 1 July 2015, with the staged adoption of obligations by 1 July 2019. This required a substantial work program to transition our obligations from jurisdictional instruments and codes to compliance under a national framework (the NT NER). This included work to prepare our first regulatory proposal, submitted to the AER on 31 January 2018.
Power and Water joined the national electricity framework on 1 July 2015, with the staged adoption of obligations by 1 July 2019. This required a substantial work program to transition our obligations from jurisdictional instruments and codes to compliance under a national framework (the NT NER). This included work to prepare our first regulatory proposal, submitted to the AER on 31 January 2018.
It was assumed by Power and Water and the AER at the time that only minor differences between jurisdictional and national arrangements existed and that compliance with the regime would operate much the same as jurisdictional arrangements.
While accepting the limitations of traditional top- down analytical techniques, the AER concluded at its draft determination that operating expenditure targets should be set lower than our actual recurrent expenditure at that time. This conclusion was reached using category-based analysis and benchmarking and took into account other evidence and qualitative factors.
We largely accepted the AER’s position that forecast operating expenditure should be based on more efficient maintenance practices and committed to refreshing existing ICT systems and transformation of our operating structure to reduce our costs over time. On that basis, we proposed, and the AER accepted, ambitious operating expenditure targets for the 2019-24 period amounting to more than 20 per cent reduction in recurrent costs in the first year of the period. In addition, the target included a step change reduction in overheads, staggered over the five- year period.
- Transforming our operating model
Delivering an ambitious reduction in target operating expenditure involved a transformation process across the organisation. Given the limited availability to capture economies of scale, Power and Water sought to implement a new operating model aimed at capturing economies of scope by centralising and grouping ‘like’ functions rather than by line of business. While a “lift and shift” of functions has been performed to consolidate like functions the full benefits of transitioning to this new operating model have yet to be captured. This is mainly due to:
- Impact of COVID-19 in both business disruption and the ability to bring new capability into the organisation
- Executive turnover, industrial relations, and difficulty in attracting skilled resources to the Territory.
- Delays in enabling ICT infrastructure development and implementation.
- Impacts associated with transitioning to a more complex national framework, market reform, renewables uptake and other external influences.
Notwithstanding the changes made to the organisation structure, benefits in the form of cost savings have been offset by the need for additional resources to manage large solar connections and government policy changes to increase renewable energy penetration. This has not only changed our resourcing priorities but also our decision making regarding technology investment, which is explained further below.
- Transitioning to the NT NER
Meeting our obligations under the NT NER has proven to be a more costly and challenging exercise than anticipated, for several reasons including:
- Requirements under the NT NER have proven to be more onerous than anticipated – requiring more detailed analysis, justification, and information than under jurisdictional arrangements. Meeting our reporting requirements has posed a significant challenge for Power and Water as our systems lack the capability to capture and report data at the granular level required by the AER. Given limitations associated with our existing ICT systems, meeting our reporting requirements often requires substantive manual effort to compile the information which diverts resources away from their normal business as usual activities and creates a backlog of tasks.
- Arrangements under the national regime are constantly evolving – unlike jurisdictional arrangements which were largely stable, the National Electricity Rules has evolved significantly since Power and Water has joined. The complexity in how National Electricity Rule changes flow through into the NT NER, and the pace and volume of change occurring at a national level, has proven difficult for Power and Water to keep up with. At the time of submitting our regulatory proposal the NT NER was at version 21. After four years, it is at version 88. This has meant that at the same time Power and Water was seeking to transition to compliance with the NT NER, the rules themselves have been changing. Power and Water is a small network, relative to other networks. We are unused to and ill-equipped (due to ageing ICT systems) to respond to the volume of change (particularly the transformational nature of change) that has been occurring at a national level.
These factors contributed to higher levels of opex during the 2014-19 regulatory period and at the start of the current regulatory period, as further work was required to address compliance gaps associated with meeting our connection framework obligations and our obligations under the AER’s ring-fencing guideline.
- Market reform and rapid uptake of renewables
Territorians have embraced solar and renewable energy at a rapid pace. Market frameworks and Power and Water’s network have not been managed to keep pace with this rapid rate of change. This issue quickly came to the forefront of attention in the Territory with the Alice Spring’s system 'black' event in October 2019.
The system black event was triggered by the power system not being in a secure operating state and having insufficient spinning reserve to cope with unexpected cloud cover that caused solar generation to drop suddenly. In response to this incident, a review of the state of system security and the adequacy of existing market arrangements to support the 50 per cent uptake of renewables and emerging technologies was undertaken.
This has resulted in a series of urgent priority reforms being progressed by the NTG in June 2020, as part of the Northern Territory Electricity Market (NTEM) priority reforms process. While that significant jurisdictional reform was occurring, reform at a national level aimed at addressing system security issues and integration of distributed energy resources was also occurring. Both of these developments and the sudden influx of solar farms seeking to connect to Power and Water’s network triggered the need for Power and Water to reprioritise its focus to ensure that our network is more resilient to impacts from accelerating large scale and small scale solar. This resulted in the need for additional changes to our operating model and necessitated the resequencing of ICT system upgrades that were planned as part of Power and Water’s transformation program.
- Level of business maturity and system limitations
A contributing factor to our high level of operating costs in the past has been the fact that a number of Power and Water’s core operating systems are approaching, or are already beyond, their useful life. Our existing systems do not have the capability of capturing or tracking data at a granular level, and are not configured to extract data in the format required by the AER. This creates a significant reliance on manual reporting and data manipulation, which in other networks would ordinarily be automated and centralised through ICT systems.
While Power and Water proposed a significant uplift of its ICT systems during the 2019-24 regulatory control period to address this issue and embed greater efficiencies in our operations this has not come to fruition for the following reasons:
- Projects relating to centralising and upgrading system control functions to provide additional functionality to SCADA, system management and fault response were put on hold early in the period pending greater certainty around market reforms.
- The costs associated with delivering our ICT program have proven significantly higher than anticipated at the time of preparing our forecasts. This is in part attributable to our lack of business maturity in this space and reliance on external consulting advice which underestimated the complexity and cost impact from operating a government owned multi-utility. Further market research and analysis has since revealed that our forecast overstated benefits and our delivery capability, and understated costs. This has triggered the need for reprioritisation and sequencing of ICT programs to determine what can be realistically delivered within the allowance and in light of changing business priorities.
Consequently, the full suite of planned system upgrades to deliver efficiencies and uplift business capability have not been delivered during the current regulatory period. Instead, this will be delivered in the forthcoming regulatory period based on a more accurate understanding of costs, delivery capability, and is reflected in the lower levels of opex projected for the 2024-29 period.
- Changes in accounting treatment of shared costs
Decisions regarding Power and Water’s target operating expenditure in 2019 were made on the observation that our recurrent operating costs were much higher than industry peers. The reasons for these higher costs could not be reconciled between different operating and environmental considerations, the effects of different reporting and accounting approaches, or some level of inherent inefficiency which customers should not pay for.
Inconsistencies in historic financial data and the ability to reliably compare Power and Water’s own costs at an aggregate and category level with peer networks further contributed to uncertainty regarding the relative efficiency of Power and Water’s operating expenditure.
We have been reviewing our regulatory accounting practices and sought advice as to whether improvements can be made to better compare our costs against industry peers. The advice recommended transitioning accounting treatments for labour cost and support costs so they were more consistent with industry peers and would assist with better comparison of Power and Water operating costs.
In response, we have made changes to how we capture internal labour rates and how we attribute labour related costs to operating activities. We have also tried to align our approach to attributing overhead costs to direct capital and operating activities so it is more consistent with industry peers. While both of these changes have not fully explained reasons why our costs are higher than industry peers, our analysis of backdated data demonstrates that some of the category analysis benchmarking would have presented differently if we had applied the same approach in our previous determination.
Key opex drivers
Moving forward, key drivers of our operating costs for the 2024-29 regulatory period are likely to be:
- Ongoing market and regulatory reform – changes in our obligations will impact upon compliance costs and can trigger the need for additional resourcing and system changes.
- Technology enablement – our ability to reach a more sustainable and efficient level of opex is dependent upon our ability to modernise our ageing ICT systems.
- Customer preferences – initiatives to reduce costs in customer service areas were challenged by customers in our People’s Panels engagement. While most were reasonably satisfied that closure of shopfronts was the right decision, they provided reasons why Power and Water may need to do more than networks in other regions in respect of providing education, advice and support. Our proposal includes such preferences as step changes to our recurrent forecasts.
5.3 Adjusted base year
Our forecast method proposes the use of audited 2022 financial year actual operating expenditure as the base year. This will represent the most recent audited financial year at the time we submit our regulatory proposal. Adjustments for non-recurrent expenditure and top-down efficiency checks will be made to ensure it is useful for forecasting future costs.
For this Draft Plan, we have used a year-to-date projection of actual operating expenditure for the 2022 financial year (FY22). This is because our Draft Plan has been prepared ahead of finalising our statutory and regulatory accounts by October 2022. We may choose to adopt audited FY23 expenditure to support a revised forecast at the time of our revised proposal, depending on any material changes between years.
Based on our FY22 cost incurred to March 2022, we are projecting the following adjustments need to be made to the base year to normalise it for forecasting purposes:
- Adjustments to one-off project related costs that will not be incurred in the next period.
- Adjustments to reflect our expectations of labour costs that will be incurred and attributed to operating activities by the completion of the full financial year.
- A further one-off adjustment to reflect the fact that a greater proportion of overhead costs will move to capital expenditure in the next period.
- Top-down efficiency check
We have noted above the challenges in explaining the variance between our recurrent costs and those of our peers. This has been improved through changes to how we account for costs to improve the metrics we are comparing. However, the reality is that there are a range factors which conceptually explain why the uniqueness of our business will result in higher costs and many of these factors are difficult to quantify.
The AER also acknowledges the challenges and indicated that work would continue during the period to investigate how some of these differences could be quantified. Our concerns relate to the implicit cost of attempting to properly quantify some of these unique differences which may still result in an unclear conclusion.
Some of the important differences of our business compared to others include:
- We are an end-to-end supplier of power across the Territory, with roles and responsibilities much broarder than single role DNSPs.
- We are the main essential services provider in the Territory operating a multi-utility with a back office sized to support all services.
- Power and Water is the only network operator regulated by the AER that has no interconnection with the National Electricity Market.
- While not regulated by the AER, significant costs are incurred by our networks division for remote and regional essential electricity network services. The application of our AER approved Cost Allocation Method drives a higher portion of all overhead costs to our activity on regulated networks. Our regulated network services include corporate overhead costs which would otherwise be attributed to remote and regional services if the allocation percentages were the same.
- We provide essential transmission related services in Darwin-Katherine and have a much closer operational relationship with system control and market operation activities compared to other distribution networks.
- Power and Water’s network operation supports critical roles in system control and network operation in the Territory, and is responsible for developing various technical instruments that enable statutory objectives to be met, notably the Network Technical Code and System Control Technical Code. It performs a technical role equivalent to the Chapter 5 NER Schedules.
- As the only NSP regulated under the NT NER, it is relied on as the sole entity that can provide informed insights from the network perspective to policy debates and rule changes subjecting it to greater regulatory burden and associated costs under the NT regulatory arrangements.
- Other environmental factors already recognised by the AER continue to exist.
- Adjustment to base year for efficiency
The challenges around making the necessary adjustments for meaningful benchmark comparisons were well documented in the last distribution determination.
Despite the uncertainties around the gap, Power and Water still recognises there is a responsibility to set strong targets for improvement in the level of operating expenditure. Our internal examination of our base year to identify efficiencies has involved looking at our performance in the past and assessing if there were any opportunities for efficiencies to reduce the base year amount. Our approach to adjustments in the future period is as follows:
- For direct operating expenditure items, we will use the AER determined operating expenditure target identified in the last determination as a guide to establish our forecasts. We will use the lower of the out-turn actual expenditure in the base year and the AER’s previous allowance.
- For overhead related items, we recognise cost reductions in the current period do not align with the AER’s expectations implied in the allowance. This was due to necessary changes in our service model to establish the foundation for cost reductions to be delivered over time. We have consequently proposed that stretch targets from the AER’s current allowance be extended into the next period so that overhead related costs are reduced by 10 per cent – staggered over the period.
5.4 Trends
We calculate the trend in forecast operating expenditure from the adjusted base year expenditure amount. This reflects changes in workload levels, prices of materials and labour, and productivity compared to our base year. We will calculate a trend adjustment for each yearfrom FY23 to FY29 using the AER’s rate of change formula. Three factors we look at include:
- Input cost escalation – We use materials, labour and contractors to undertake operating expenditure activities. While we automatically include inflation in our forecasts, the price of the inputs may be higher or lower depending on demand. We are working with network service providers in NSW, ACT and Tasmania to ensure a common methodology and independently verified outputs are used for escalation of labour, materials and land value.
- Output growth – As our network and customer base expands, we must perform more activities such as maintenance and customer service. This means that our costs will likely increase from the base year. We will apply the AER’s calculation which includes change in customer numbers, energy demand at peak times, and circuit length.
- Productivity growth – Our customers would expect us to improve productivity over time through technology advances, and improved processes. We will likely use the AER’s preferred approach to use industry estimates to establish the expected productivity growth and will also consider individual circumstances.
These factors are likely to change with market conditions and could change significantly between now and our regulatory proposal in January 2030. Our forecast rate of change is shown below in Table 1.
Table 1 – Rate of change forecast
| Rate of change | Jun 2025 | Jun 2026 | Jun 2027 | Jun 2028 | Jun 2029 |
|---|---|---|---|---|---|
| Forecast output change | 1.68% | 1.72% | 1.71% | 1.68% | 1.65% |
| Forecast price change | 0.48% | 0.39% | 0.36% | 0.43% | 0.56% |
| Forecast productivity change | 0.50% | 0.50% | 0.50% | 0.50% | 0.50% |
| Forecast rate of change, year-on-year | 1.66% | 1.61% | 1.57% | 1.62% | 1.71% |
| Forecast rate of change, cumulative | 1.66% | 3.29% | 4.91% | 6.60% | 8.43% |
Step changes
Step changes relate to increases or decreases in expenditure related to changes in our business environment, and which have not been reflected in the base year adjustments or trends adjustments. We will use the criteria in the AER’s Expenditure Forecast Assessment Guidelines to identify potential step changes.
This includes identifying new obligations in NT and national regulations. Our organisation has been adapting to material changes in our regulatory obligations. Significantly, our ongoing transition to national electricity regulation requires an uplift in resources and systems to comply. We will seek to identify new obligations and provide detailed information on the efficient costs to comply. The obligations that we will need to manage in the transitioning Northern Territory Electricity Market are still to be resolved. Recent changes to National Electricity Rules in respect of export services will require a step change in costs, particularly when combined with the increasing need for our network to host greater capacity of solar while ensuring safe and reliable supply of energy. This will require increases in costs.
We discussed with customers the changing service delivery model to enable greater penetration of renewables in our system. Our customers generally believed that we should increase costs to facilitate and support the uptake of solar. They noted:
- Where technologies are proven, they should be adopted to help achieve renewable targets.
- We also need to move forward by piloting new technologies.
- Community outcomes should be considered to reduce or optimise outcomes and to minimise disadvantaged, so no one should be left behind.
- More needs to be done for remote and disadvantaged communities, which could be facilitated through government support.
- More needs to be done for remote and disadvantaged communities, which could be facilitated through government support.
Our forecasts therefore include costs to reflect greater obligations to enable more solar on the grid. This will be backed by our Distribution Energy Resource Integration Strategy and Future Networks Plan.
Other step changes relate to customer feedback in the area of customer service. Power and Water adopted a number of strategies which reduced operating costs. Customers at our People’s Panel were concerned that some of these changes – particularly those relating to the closure of shop fronts – did not reflect community expectations around Power and Water’s advisory and support role. We were able to explain to customers some of the changes that we have incorporated to still ensure support – including face to face discussion – is available and effective, but at much lower cost.
While our outlined response provided some comfort, customers still wanted more to be done regarding face to face communication and customer centric advocacy. Our step changes include additional expenditure consistent with these recommendations.
Our proposed step changes are outlined in Table 2.
Table 2 - Step changes
| Step changes ($m, 2024) | Jun 2025 | Jun 2026 | Jun 2027 | Jun 2028 | Jun 2029 |
|---|---|---|---|---|---|
| Customer Service – support/admin officer and customer advocate | 0.43 | 0.43 | 0.43 | 0.43 | 0.43 |
| Customer Service – travel and marketing | 0.11 | 0.11 | 0.11 | 0.11 | 0.11 |
| Customer Service – Enabling ICT | 0.21 | 0.21 | 0.21 | 0.21 | 0.21 |
| Future Networks – Hosting capacity and DER integration | 0.8 | 0.8 | 0.8 | 0.8 | 0.8 |
| Future Networks – ICT enablement | 0.54 | 0.54 | 0.54 | 0.54 | 0.54 |
5.6 Category Specific Forecasts
A category specific forecast may be justified if, as a result of including a specific opex category in the base opex, total opex becomes so volatile that it undermines our assumption that total opex is relatively stable and follows a predictable path over time. Our proposal includes the category specific forecast for debt raising costs.
Debt raising costs are the benchmark costs of issuing debt, including the costs of maintaining an investment credit rating needed to issue this debt. Table 3 presents the debt raising costs included in our proposal.
Table 3 - Debt raising costs
| Step changes ($m, 2024) | Jun 2025 | Jun 2027 | Jun 2027 | Jun 2028 | Jun 2029 |
|---|---|---|---|---|---|
| Debt raising costs ($m, 2024) | 0.61 | 0.63 | 0.65 | 0.67 | 0.69 |