7. Metering services
For the 2024-29 regulatory period, we are proposing to continue installing smart meters for all new and replacement installations, including the ongoing replacement of our mechanical meters that have exceeded their operational life. Our proposed metering expenditure seeks to develop a smart meter fleet that facilitates our customers’ choices to install renewable energy installations on the network, while addressing condition, accuracy and reliability issues associated with our current mechanical meters.
Our metering service is an alternative control service where we identify an individual charge for the service separate to the standard service.
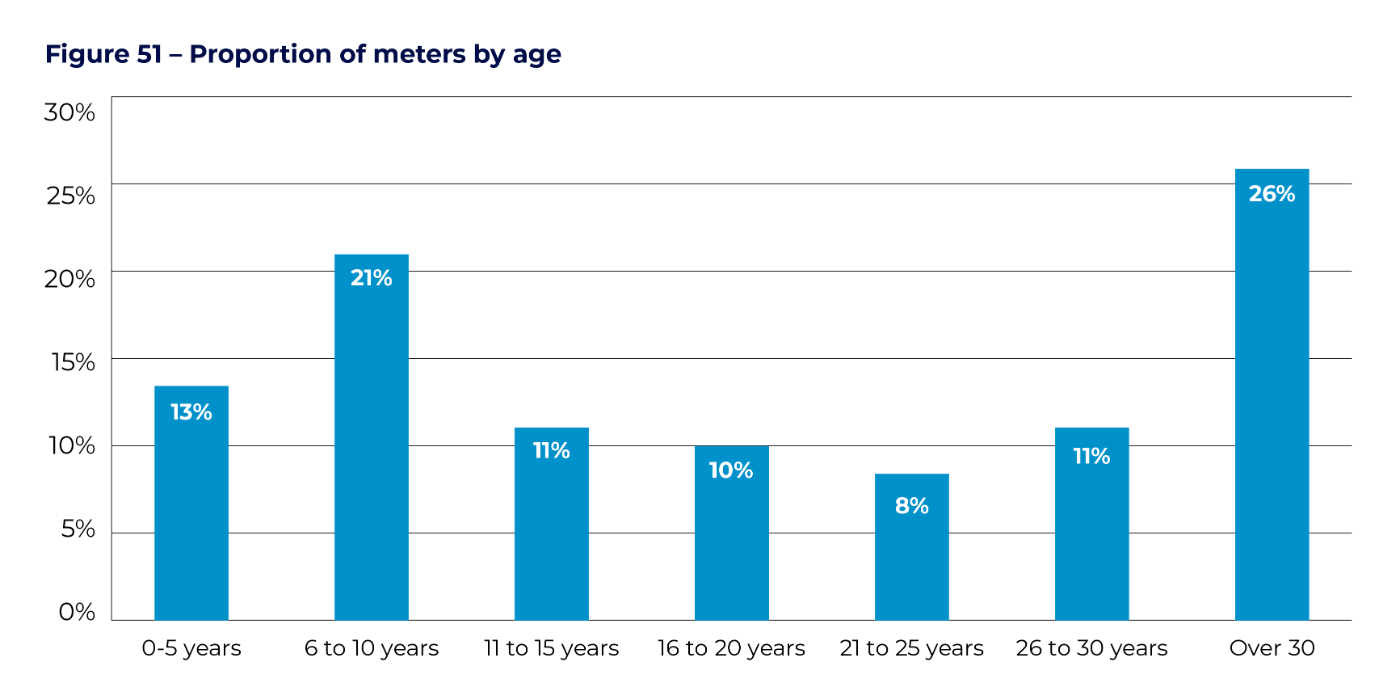
Our electricity meter population is about 87,500. Of these, about 24,250 are smart meters. Our current non-smart meter population are mostly very old, mechanical meters which have accuracy issues and are close to or beyond their economic life as illustrated in Figure 51. To address this, we are proposing to continue our progressive rollout of smart meters which is underway in the current regulatory period.
The move to smart meters is consistent with national trends and customer preferences. Our investment in smart metering has generally been supported by our customers, as it removes the need for manual reads. Smart meters also enable us to facilitate growing solar and battery connections on our distribution network as well as prepare for customer uptake of electric vehicles. As noted in the next chapter, smart meters are a prerequisite for implementing more efficient tariffs that incentivise customers to use appliances in off- peak periods.
Other benefits from smart meters include better network fault identification, more accurate meter reads, and the ability to better comply with stringent metering requirements under the national electricity rules.
Our progressive rollout is planned as follows:
- Of our 63,250 non-smart meters, 21,000 will be replaced or upgraded to smart meters in the remainder of the current regulatory period.
- Half of the remaining 42,250 are proposed to be replaced with smart meters over the 2024-29 period.
7.1 Metering capital expenditure
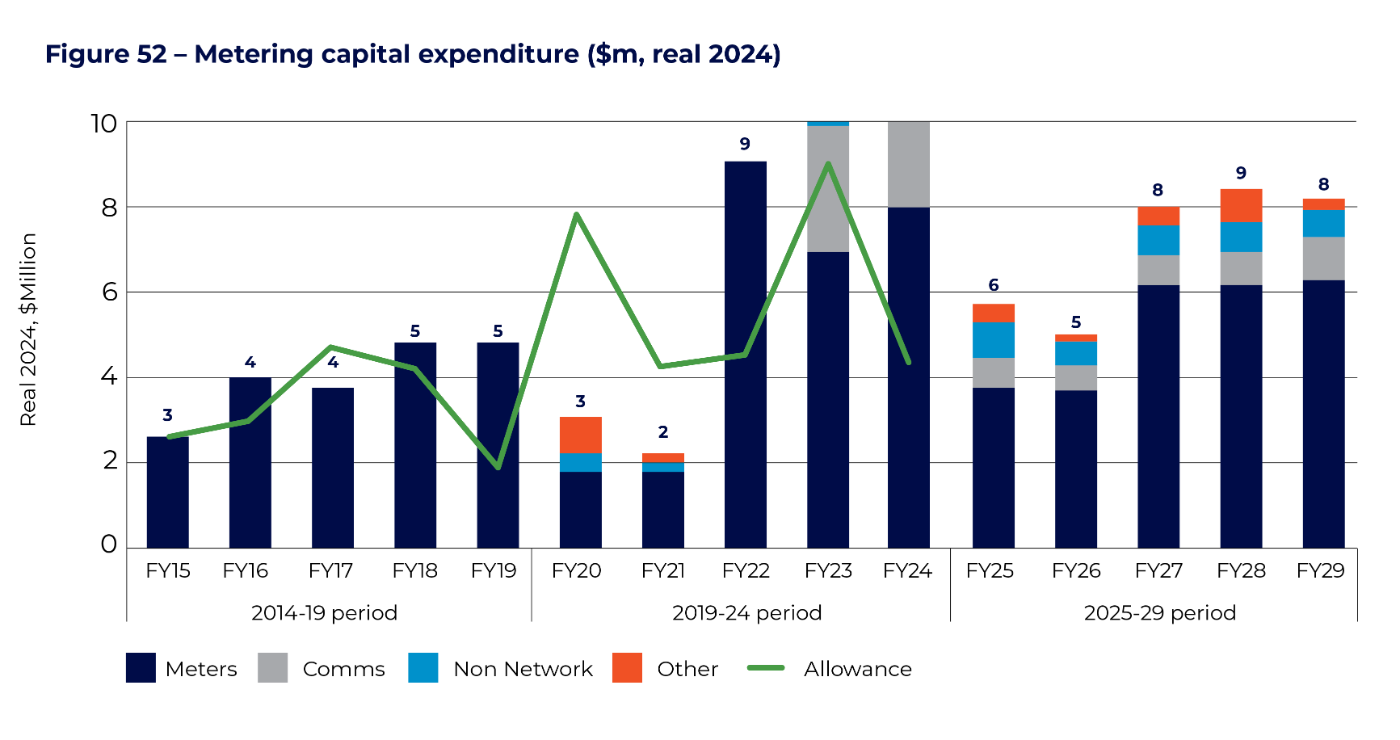
Our metering capital expenditure forecast of $36.0 million (2023-24 real dollars) for the 2024-29 regulatory period is consistent with our aim of a progressive rollout of smart meters. This represents a decrease of nine per cent over the forecast expenditure of $39.8 million in the 2019-24 period, and an increase of 19 per cent over the regulatory allowance of $30.3 million. This is shown in Figure 52.
Our capex forecast for 2024-29 is founded on a proposed acceleration of the meter and modem replacement program over the last two years of the current regulatory period. Our planned meter and modem replacement programs for 2019-24 have been delayed because our metering IT systems were unable to manage the increase in data from the planned works. With these constraints now addressed, we expect to ramp up this program from 2022-23.
We considered both a slower and a faster smart meter rollout as part of our preparation for our initial regulatory proposal. We are proposing a middle option of a progressive rollout to balance costs for consumers, resourcing needs and compliance issues. We believe the capital program provides the most appropriate and sustainable transition to a safe, accurate, and reliable meter population going forward.
Other points of note regarding our metering capex program are:
- The overall meter population is less than stated at the last regulatory determination. Several thousand customers have three meters, which are used as a single meter for billing purposes. We have now changed this to be a single meter in our metering register and have undertaken a significant data cleansing exercise in our billing system, resulting in a more accurate (and lower) count of meters. The combination of these issues has caused significant under- recovery of metering costs in the current regulatory period.
- An additional driver of capital expenditure is an allocation of approximately $6 million to replace asbestos meter panels on customer premises where it is unsafe to replace the meter on the existing panel. This is a continuation of a program that was approved in the last determination.
- There is a dip in capital expenditure in the first two years of the regulatory period. The rationale for this is that we have a significant population of unregulated meters (around 15,000) that we are responsible for. These meters form part of various isolated systems in the NT that are not connected to the regulated networks. Similar to the wider, regulated meter population, many of these meters are at the end of their useful life and require upgrading. Funding for these upgrades is separate to the AER process and approval is currently being sought. Pending this approval, it is expected that this work will be undertaken in 2024-25 and 2025-26. This will mean resources will be redirected to this work, necessitating a reduction in the replacement program for regulated meters for this two year period.
7.2 Metering operating expenditure
Our metering operating expenditure relates primarily to costs associated with reading meters and maintaining meter data. Opex is derived via the Base Step Trend method and is forecast to be $31 million over the next regulatory period, an overall decrease of 14 per cent relative to actual forecast expenditure and 1.3 per cent relative to the regulatory allowance for the current regulatory period, primarily driven by:
- The application of overheads to direct expenditure costs.
- Escalation factors applied to the base year operating expenditure.
- Increases in our meter testing and inspection rates to comply with the requirements of Chapter 7A of the NT NER.
7.3 Revenue impacts from metering expenditure
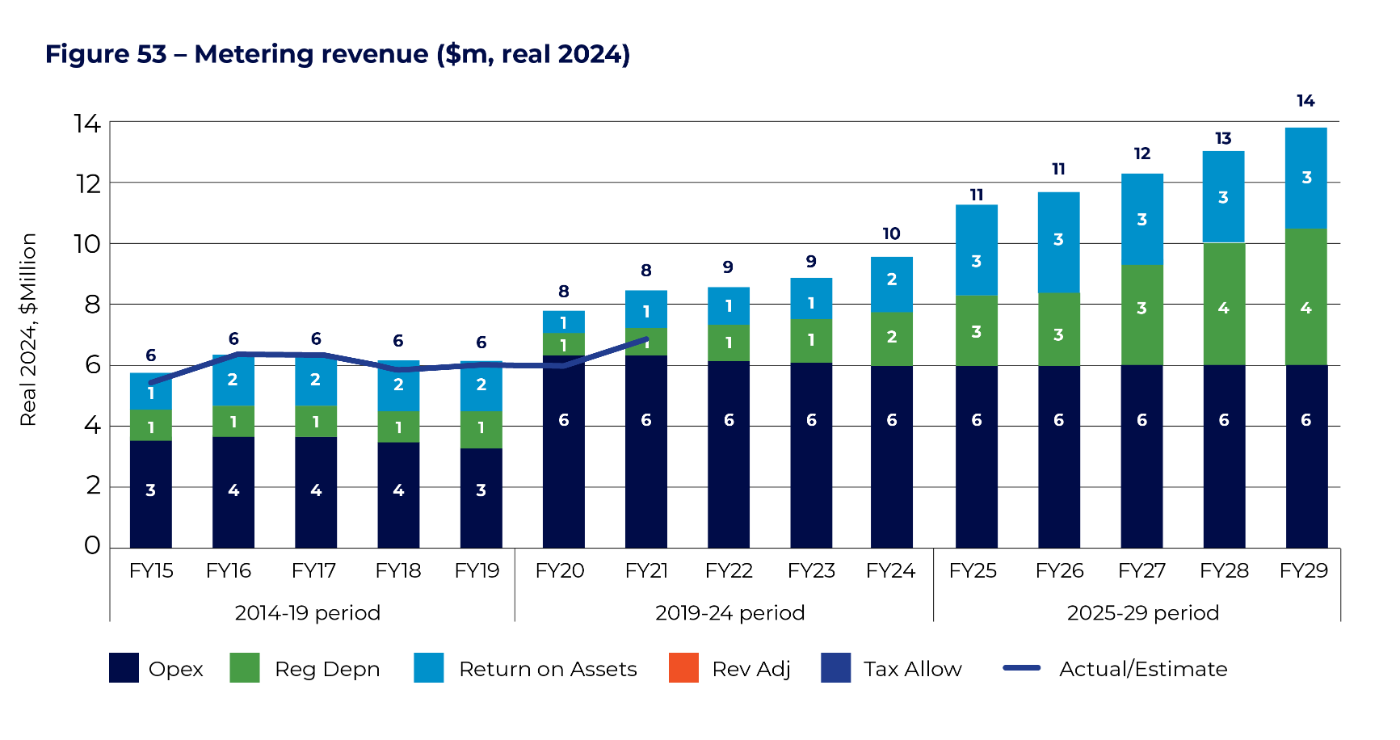
The expenditure proposals outlined above result in a revenue requirement of around $11.0 million in the first year of the regulatory period, rising to $13.8 million by year five. The correction of current under-recoveries, along with the increased capital program, result in an increase in annual metering charges to customers of 43 per cent as a one-off in 2024-25, followed by smoothed price increases of 1.34 per cent in subsequent years. For a small customer with a single phase meter this is an increase from $67 to $101 in year 1. The revenue outcomes can be seen in Figure 53.
The major driver of revenue increases is the increase in capital expenditure relative to the capital expenditure allowed in the current regulatory period. In particular, our meters were almost fully depreciated by the start of the 2019-24 regulatory period, so as our meter replacement program progresses, the metering regulatory asset base will grow, in turn increasing the return on and of capital.
We also propose a change in the way our metering services are currently categorised to more correctly apportion costs between customers, particularly for low voltage CTs and HV customers.