Summary
The expenditure plans presented in the Draft Plan would lead to a revenue increase of 10 per cent (excluding inflation) compared to the 2019-24 current period. This is higher than anticipated at the time of our customer consultations in April 2022 due to a rapid increase in financing costs. In light of rising cost of living pressures, we consider this is an opportune time to re-visit our customers’ preferences. The key issue is what expenditure can be deferred to improve short term affordability and what are the short and long-term risks.
This Draft Plan provides our initial view on the expenditure, revenue and tariffs for the 2024-29 regulatory period for our regulated electricity networks in Darwin-Katherine, Alice Springs and Tennant Creek. Chapter One of our proposal provides relevant background on our customers and our role in providing network services.
The purpose of the Draft Plan is to open a conversation with our customers on our strategic direction and the details of our plans. Our customers have been central to the development of our initial plans. Our engagement activities commenced in September 2021 and have focused on speaking directly to our customers.
A key innovative approach was to convene People's Panels in Darwin and Alice Springs – a group of representative customers that devote weekends to help shape our plans for the future. The vision, values and priorities have deeply influenced the plans set out in this document. Chapter 2 provides further information on our customer engagement activities and outcomes.
Adapting to unprecedented change
Our three separate regulated networks supply the smallest number of customers of any network in Australia. This places us under an immense scale disadvantage relative to other networks in Australia. We operate in difficult environments subject to extreme heat and weather events that place further pressure on delivering our services. Our small scale is further exacerbated by resourcing constraints in the NT.
Our small network is facing disruptive and fast paced change driven by global and local factors including climate change, electrification of transport, ageing network assets and a growing economy. Our functions and cost structures will change dramatically over the next 20 years. The strategic priorities we discuss in Chapter Three of this Plan are about adapting to change in a way that can maintain affordability and quality of services. This is discussed below, and is depicted in Figure 2. Our regulatory proposal has sought to embed our strategic priorities in our five-year expenditure, revenue and tariff plans.
Transition to low-cost renewable energy
Our most pressing challenge is facilitating the NT’s transition to renewable energy. Renewable energy offers the Territory the benefits of clean and low-cost power that can unlock capacity to grow our economy.
Our network lies at the centre of fulfilling the Northern Territory Government’s (NTG) goal of 50 per cent renewable energy by 2030. Our transmission network will need to relocate and expand to meet a rapid increase in large solar farms including connecting new ‘renewable hubs’ announced by the NTG. We will also need to adapt our network to provide increasing exports at the street level.
Figure 2 - Drivers of change impacting our business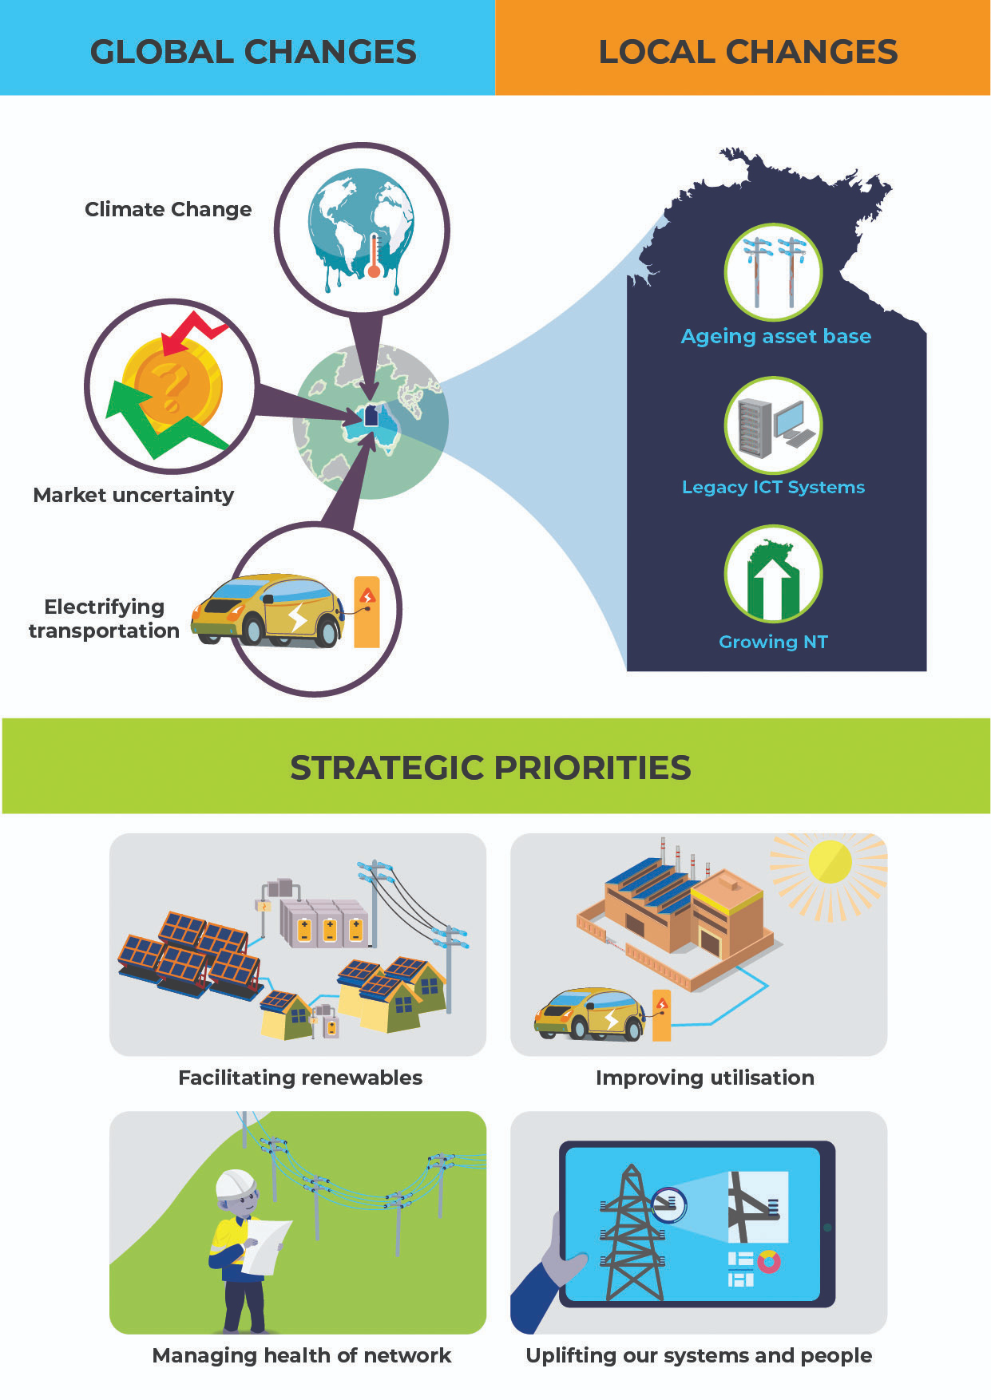
Our strategic planning is looking beyond 2030 as we plan for a NT electricity system that is more reliant on renewables. This will be a significant engineering challenge for our network which was built for one way traffic from large fossil fuel generators. We will need to draw on modern technology to re-shape our network to deliver exported energy at the street level.
Our five-year plans for 2024-29 include a new export hosting system to cost-effectively unlock higher levels of household solar. We will also be investing in community batteries to store excess solar in the day and discharge in the evening when the sun is not shining.
Meet the growing demand of Territorians
We expect demand to significantly increase over the next 20 years. The NTG predicts our population will increase by more than 30 per cent by 2040. In addition, we will need to provide electricity to major industrial customers locating to the Territory.
Electric vehicles will also heavily impact demand for energy with each car adding approximately 30 per cent more consumption for a typical household.
This provides our network with an opportunity to increase our scale and pass on lower costs to our customers through better utilisation of the network. Our strategic priority is to provide customers with the right information and incentives to shift energy consumption to off-peak periods.
Our five-year plan includes initiatives to improve our network tariff structures so they provide customers with price signals that reflect our future costs. This includes lower prices in off-peak periods during the day when low cost solar is available and when there is significant load capacity on our network.
Managing the health of our network
We have emerging challenges ahead with managing our network assets. A large proportion of our assets were constructed shortly after Cyclone Tracy in 1974. By the end of 2030, these assets will be approaching 55 years of age. This may trigger a significant uplift in replacement capital expenditure in the following decade. We need to plan for these changes to preserve the reliability and security of the network into the future.
Our strategy will be to employ best practice asset management practices and risk tools to extend the life of these assets. At the same time, we will look to new technology to retire rather than replace ageing assets. Even with these measures in place, we still expect our replacement expenditure will need to increase significantly beyond 2030. We are looking at measures to smooth the expected price increase in the 2030 to 2040 period including through a novel approach suggested by our People's Panel – a ‘saving for a rainy day’ fund. Under this approach, a small amount of revenue would be put aside in the 2024-29 period to use when replacement capital expenditure increases in future periods.
Uplifting our people and systems
To deliver our increased functions, we will need to uplift our capability through smart systems and getting the best out of our staff. At present we use ageing Information Communication and Technology (ICT) systems that are losing functionality. We have made some investments in the 2019-24 period and will progressively implement new systems over the next 10 to 15 years. We already have in place a new operating model which will help capture synergies in the way our staff deliver services as our workload continues to rise.
Chapter Three of this Draft Plan seeks to capture feedback from our customers on our 20 year strategic outlook, including the four key priority areas that have influenced the development of our 2024-29 expenditure, revenue and tariff plans.
The right balance – affordability and investing for the future
A consistent theme in our engagement with customers has been the right balance between maintaining affordability of our network service and long term sustainability.
The change in network revenue between regulatory periods is a good metric for assessing impacts on affordability. Figure 3 shows that our revenue is forecast to increase by 10 per cent in 2024-29 compared to 2019-24, excluding the impacts of inflation. Despite this, our forecast revenue is below the allowance set by the Utilities Commission in 2014-19 and the subsequent Ministerial direction that had been put in place to reduce revenue over that period.
The revenue forecast is higher than our expectations at the time of our People's Panels sessions in April 2022, largely due to a significant change in financial markets. Figure 4 shows the change in our forecast revenue as a result of the People's Panels sessions and subsequent changes in financial markets.
Commitment to target reductions in forecast revenue
In our April People's Panels sessions we noted that our initial estimates of expenditure plans indicated a revenue forecast of $892 million, about 7 per cent higher than the 2019-24 period. We discussed levers that could reduce revenue to 2019-24 levels. This included prioritising capital expenditure, changing our accounting treatment of overhead allocation to capitalise more overheads (which defers cost recovery), and implementing efficiency stretch targets for operating expenditure. This reduced revenue to $835 million, close to actual revenue in the 2019-24 period.
Testing customer preferences for additional programs
Our customers wanted us to invest for the long-term including facilitating renewables, proactively managing the ageing of our network and improving customer service. We provided customers with options for additional programs not included in our initial expenditure estimates at the time. Customers were comfortable with the inclusion of these future looking programs even if they resulted in a small increase in revenues for the 2024-29 period compared to 2019-24. The implementation of customer preferences added $29 million to the forecast resulting in revenue forecast for 2024-29 of $864 million.
Global headwinds – financing costs impacting our forecast revenue
Since our customer consultations, our expected financing costs for the 2024-29 period has increased markedly due to higher interest rates, and global events. These uncontrollable factors have caused a further uplift in our forecasted revenues to $921 million, 10 per cent higher than the last regulatory period (excluding inflation). At the same time, inflation has risen significantly since April 2022, and this will add further cost of living pressures to our customers.
The key question posed in the Draft Plan is whether priorities for customers have shifted in light of higher than expected revenue. Improving affordability in the short-term will mean projects are deferred, and that reliability and safety risks will rise. Deferring expenditure also places price pressures for future generations, compounding the expected increase in replacement capital expenditure to manage the ageing assets built after Cyclone Tracy.
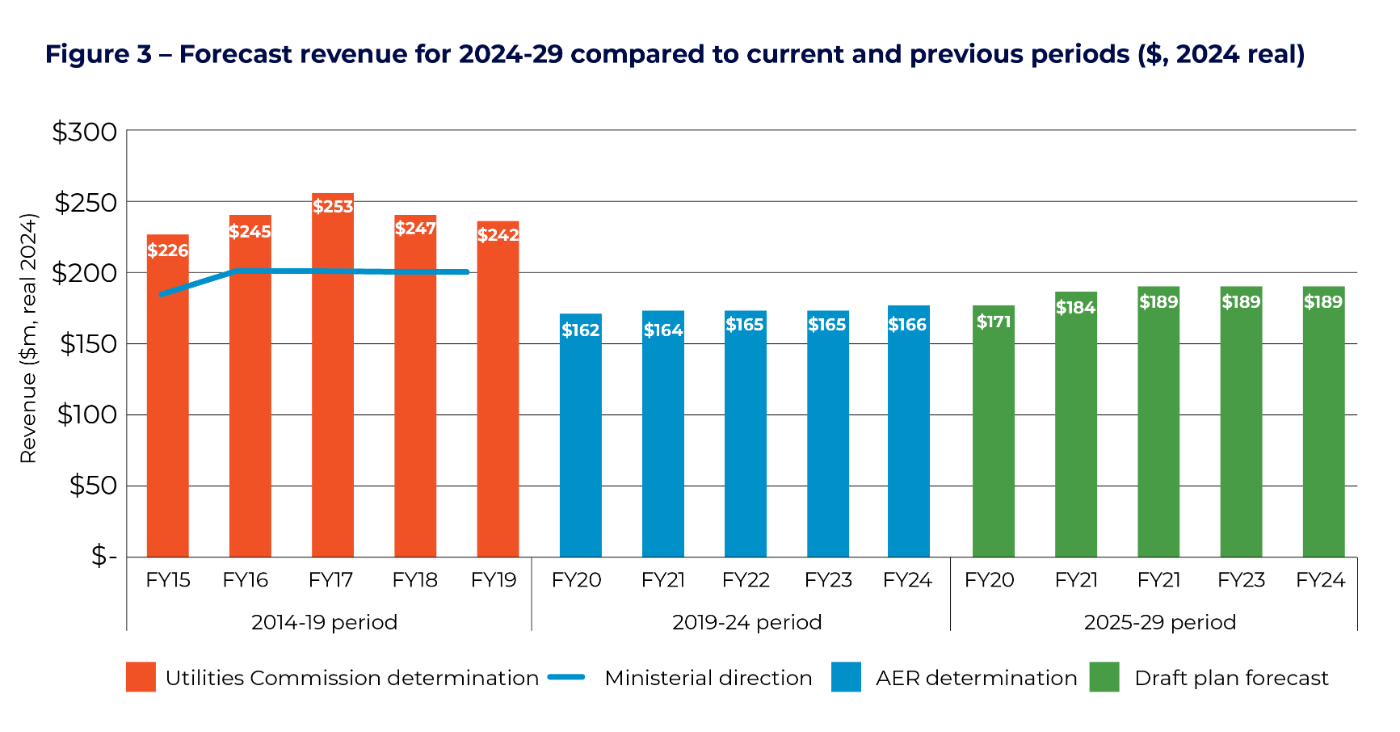
Figure 4 - Changes to our revenue forecasts since our People's Panel sessions in April 2022 ($, 2024 real)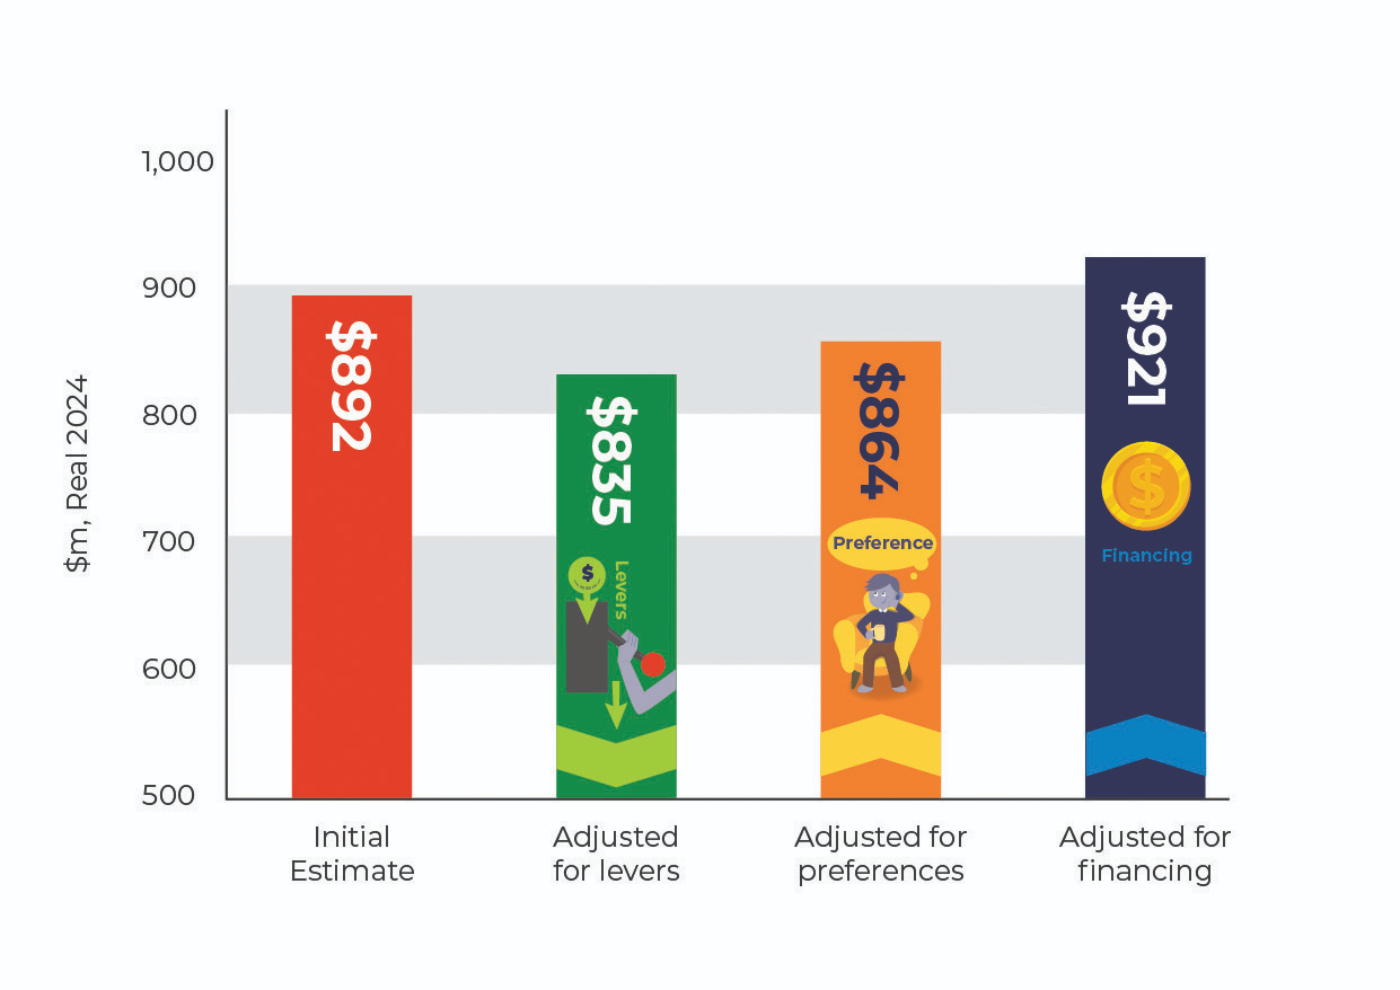
Numbers at a glance
Figure 5 identifies the key expenditure and revenue inputs in our Draft Plan. Our investment costs have risen significantly due to an increase in our forecast capital expenditure combined with an increase in the rate of return. However, the reduction in operating expenditure in the 2024-29 period is placing downward pressure on revenue. Below we provide a summary of our expenditure plans, revenue plans and tariff structure changes. All numbers are expressed in real $2024 except for bill impacts which are in nominal dollars.
Capital expenditure
We forecast a significant increase in capital expenditure in the 2024-29 period. Higher capital expenditure is driven by an expected increase in replacement and growth capital expenditure.
Replacement of network assets accounts for 40 per cent of forecast capital expenditure. The key driver of higher expenditure is an expected decline in the condition of our assets due to age and environment. The higher expenditure also reflects a replacement fund that seeks to bring forward future replacement based on customer preferences. Growth capital expenditure accounts for about 28 per cent of forecast capex in the 2024-29 period. We expect significant growth in some parts of our network to meet new residential and commercial connections. We are also investing in hosting capacity and community batteries as part of our future network strategy consistent with customer priorities.
Non-network capital expenditure accounts for about 13 per cent of forecast capex in 2024-29. We are planning to make scale-efficient and prioritised investments in the 2024-29 period to gradually refresh our ageing ICT systems. We will continue with our current lease arrangements for fleet and property, while remediating properties in poor condition. Capitalised overheads are forecast to account for 20 per cent of forecast capex in the 2024-29 period. More overhead expenditure has been allocated to capital expenditure after recent changes to align our methods with peer networks. Chapter Four provides more detail on our forecast capital expenditure.
Operating expenditure
We are forecasting a thirteen per cent decrease in operating expenditure resulting in forecasts of a similar level to what was approved by the AER in the 2019-24 determination. This is driven by improvements in how we measure underlying labour costs and efficiency targets we have embedded into our forecast.
The change in overhead allocations results in a realistic comparison of our operating expenditure performance compared to peers and is more consistent with the efficient level of expenditure substituted by the AER in the last regulatory determination. We propose to include a staggered 10 per cent efficiency stretch target reflecting our ongoing commitment to delivering real and sustained reductions in our costs over time. Chapter Five of this Draft Plan provides more detail.
Revenue and bill impacts
The 10 per cent increase in revenue is largely a result of changing finance conditions. Current market conditions are leading to an eight per cent increase in our rate of return compared to the AER’s 2019-24 determination. A further driver of higher revenue is the increase in our regulatory asset base (RAB) as our forecast capital expenditure increases in the 2024-29 period.
We have used revenue as a proxy for the expected bill increase of our customers. Figure 6 sets out the bill impacts for small customers on an accumulation meter based on forecast inflation. Chapter Six provides more detail on revenue and customer impacts.
Figure 5 – 2024-29 forecasts compared to the 2019-24 period ($2024, real)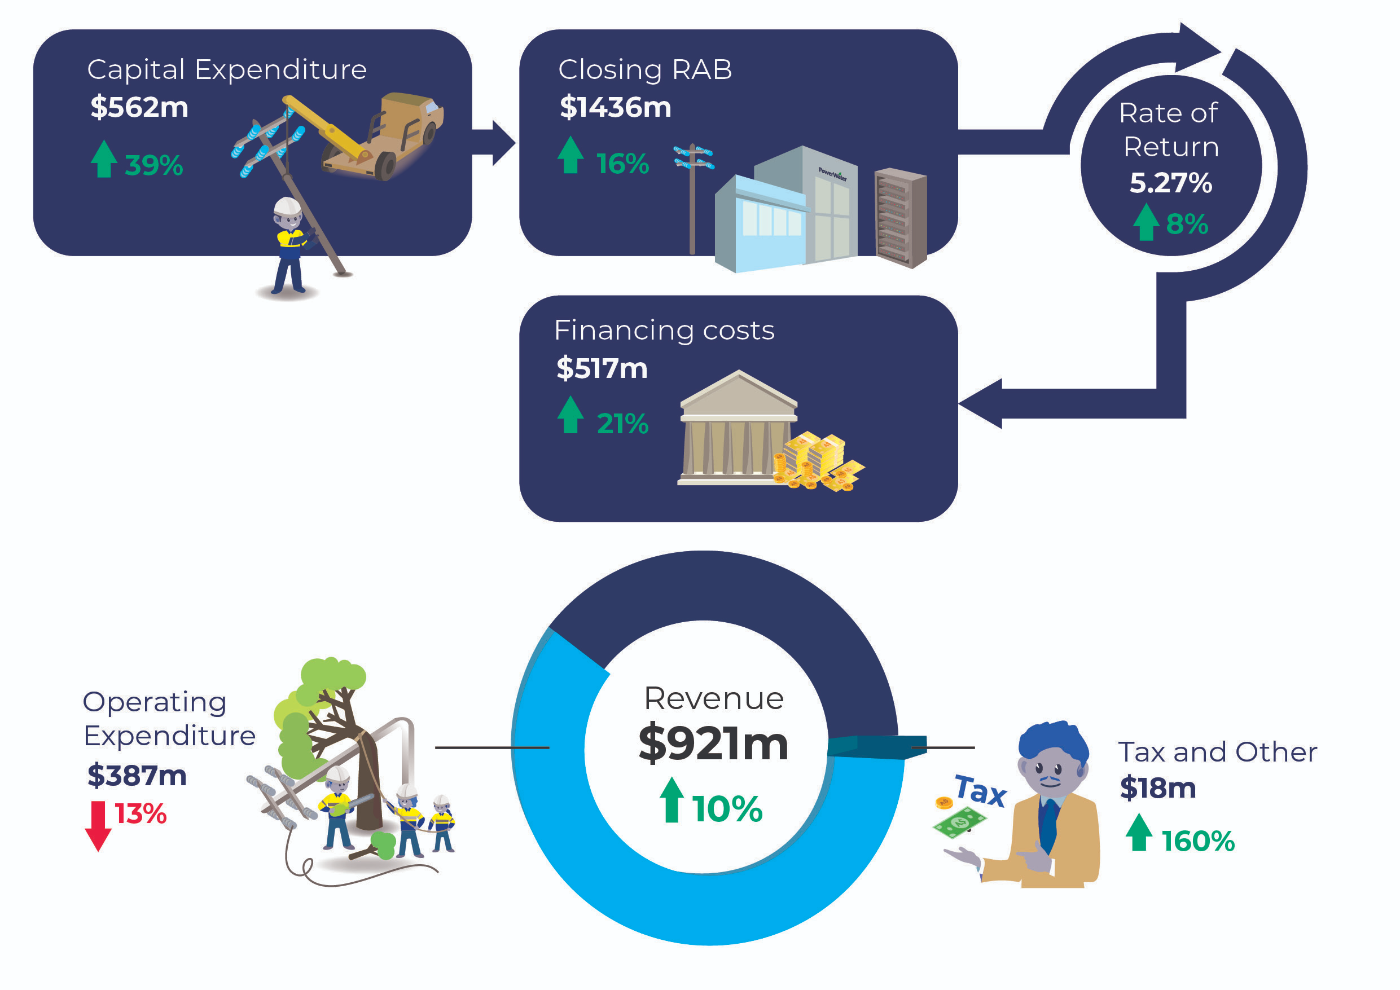
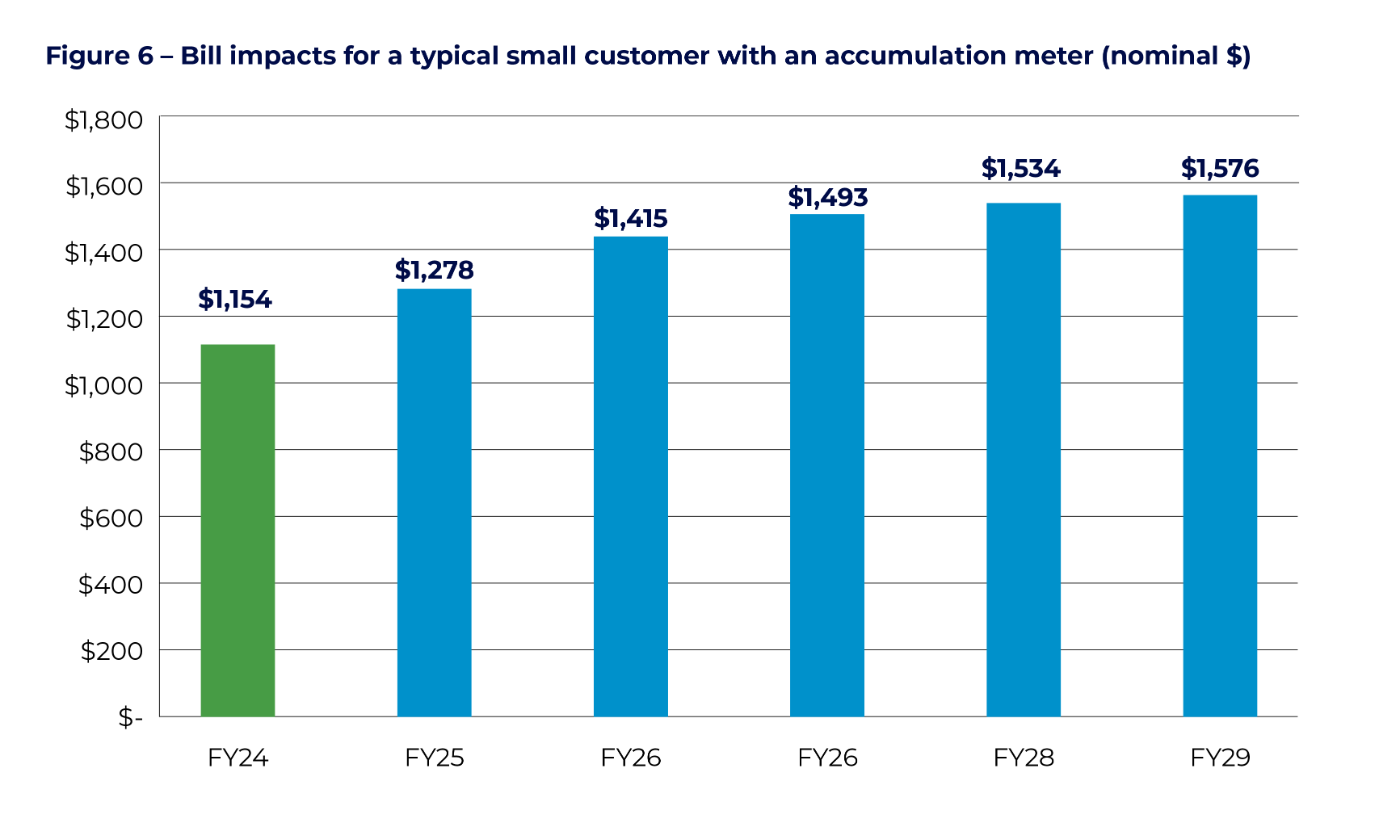
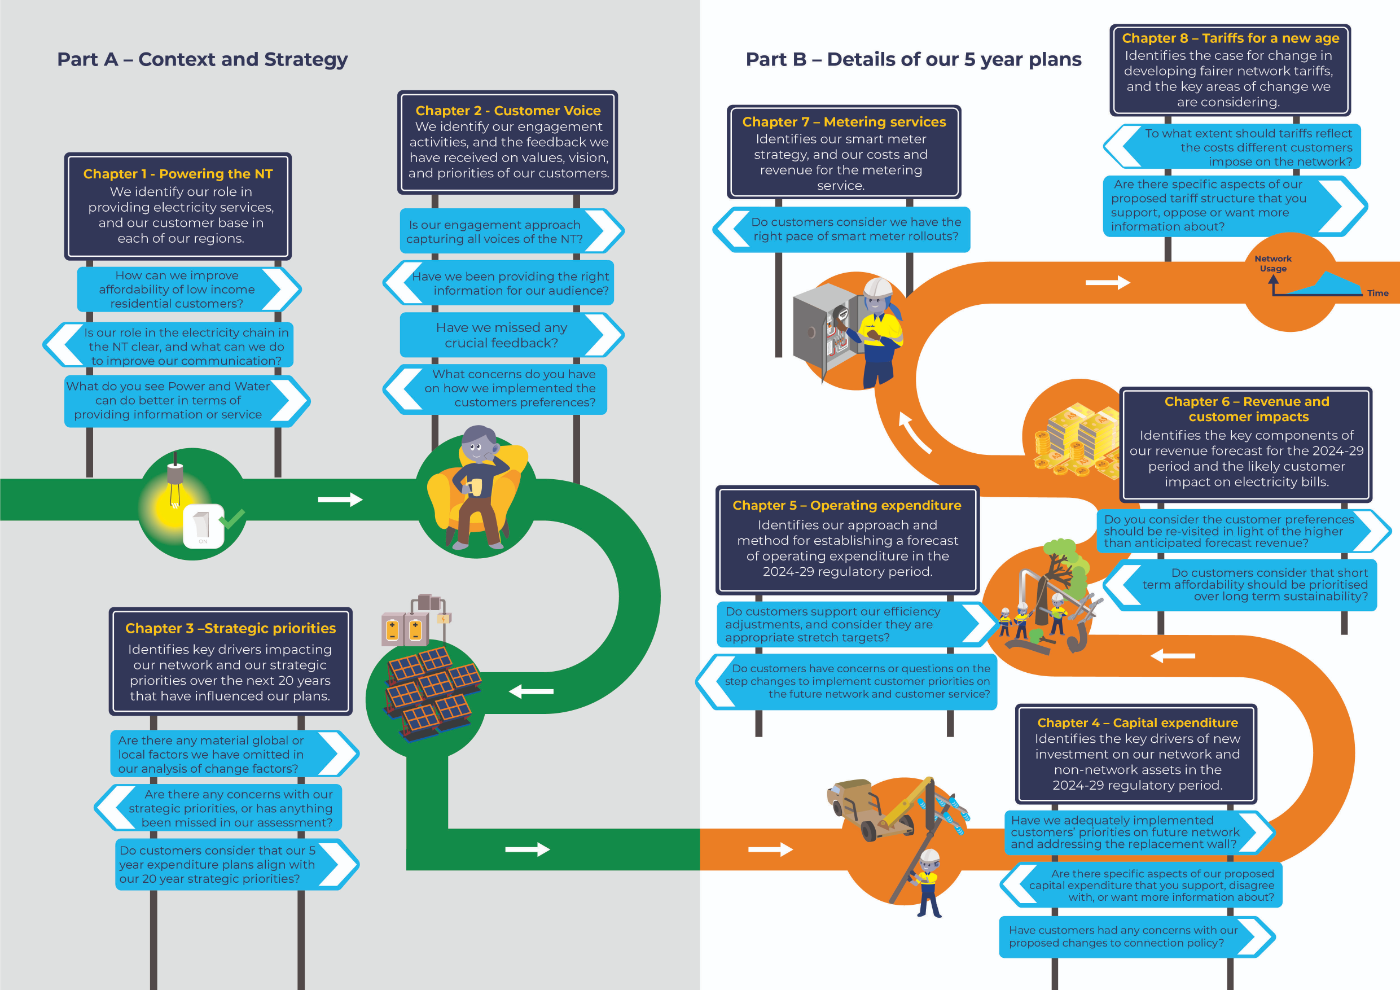
Figure 7 provides a structure map for the Draft Plan including the key questions we are seeking feedback on from customers and broader stakeholders.