4. Capital expenditure
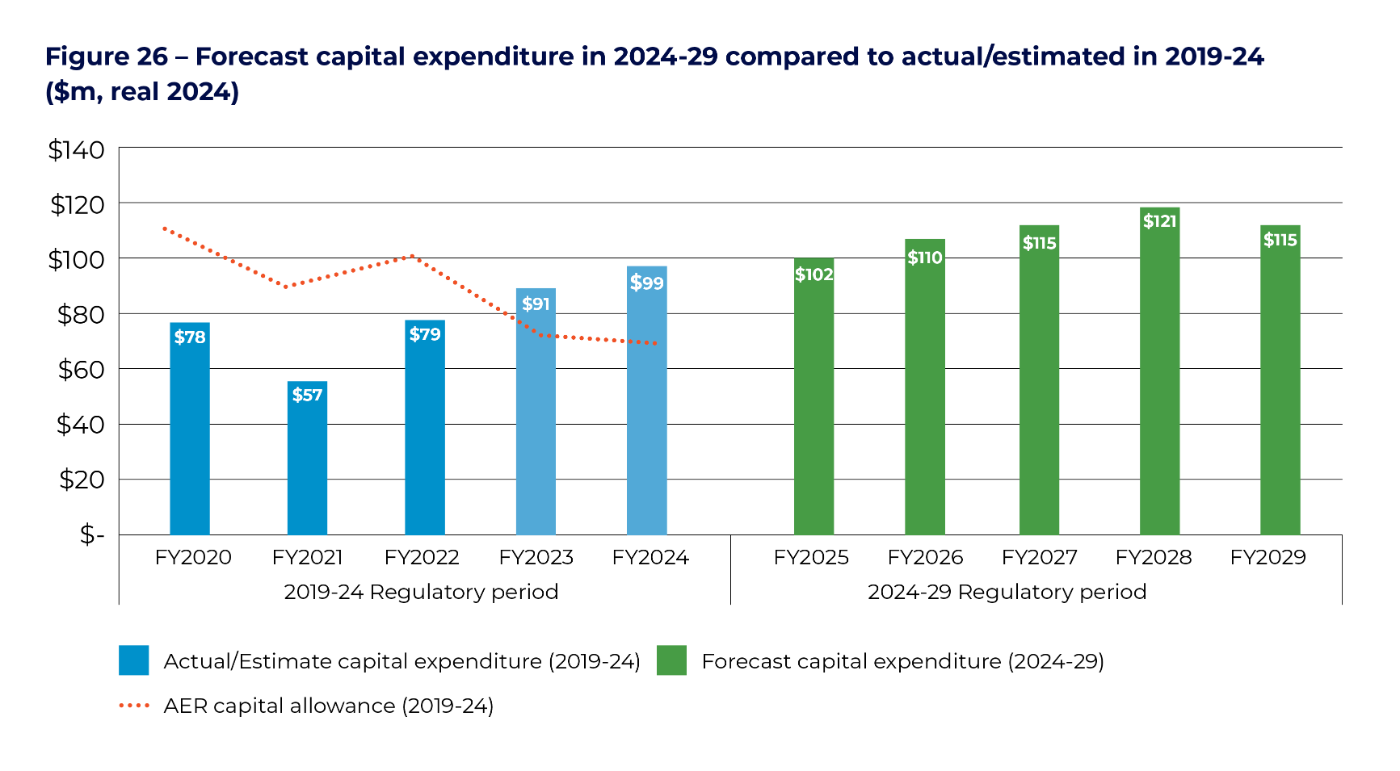
We forecast a 39 per cent increase in capex in the 2024-29 regulatory period compared to the 2019-24 current period. The key drivers of forecast capital expenditure are higher replacement to address condition issues with an ageing network, increased growth capex to facilitate growing renewables and address rising local peak demand, and a continued refresh of our ageing ICT systems. A further driver of higher expenditure has been a change in our allocation of overheads which results in higher capitalisation of overheads.
This chapter sets out our initial capital expenditure (capex) plans for our standard electricity service. In section 1.4, we noted that capex relates to money we spend on assets. We recover our initial investment from customers over the expected life of the asset .
Figure 26 provides a profile of forecast capex compared to actuals and estimates in the 2019- 24 period and compared to the AER’s regulatory allowance. In total we forecast capex in the 2024- 29 period will be $159 million higher than our estimated capex for the 2019-24 period, an increase of 39 per cent.
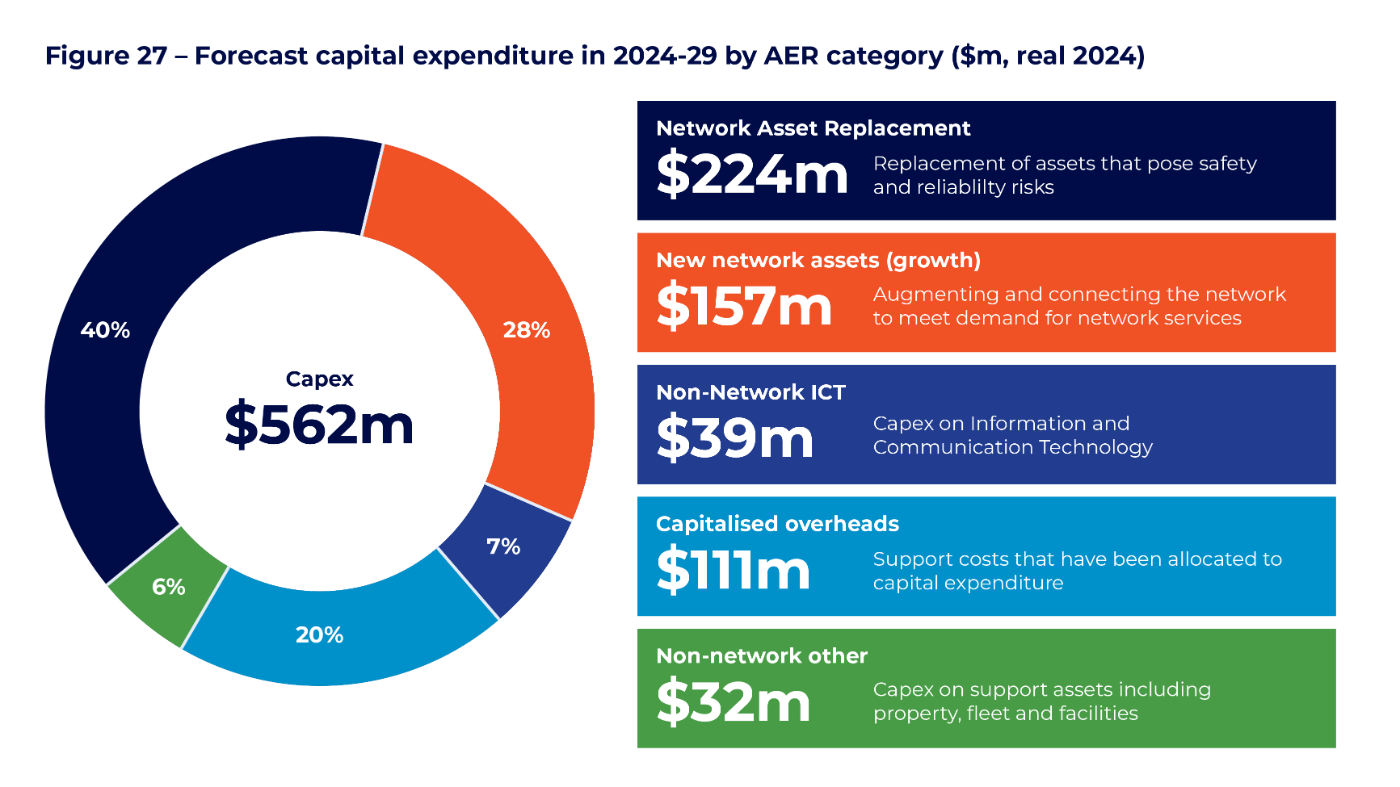
Figure 27 identifies our forecast of capital expenditure for the 2024-29 period by category, and the expected change from the current 2019-24 period.
- Replacement capex – We replace or remediate assets with condition issues, or which fail in service. In our initial plans, we expect that about 40 per cent of forecast capex will be on replacement in the 2024-29 period, an increase of $87 million compared to 2019-24 period. The key driver is a forecast decline in the condition of our assets due to age and environment, particularly given lower delivery in the current period than expected. The higher expenditure also reflects a replacement fund that seeks to bring forward future replacement consistent with our customers' preferences explained in Chapter Two.
- Growth capex – We build new network assets to meet additional demand for services (augmentation) and connect individual customers to the network (connections). This accounts for 28 per cent of forecast capex in 2024-29 period, an increase of $69 million compared to the 2019-24 period. We expect significant growth in some parts of our network to meet new residential and commercial connections. We are also investing in hosting capacity and community batteries as part of our future network strategy consistent with our customers’ priorities.
- Non-network capex – We invest in support assets including Information, Communication and Technology (ICT), corporate property and fleet. This accounts for 13 per cent of forecast capex in 2024-29, a reduction of $15 million. In the 2019-24 period, we commenced a journey to refresh our ICT systems. We will continue to make scale-efficient and prioritised investments in the 2024-29 period while maintaining our existing systems. We will continue with our current lease arrangements for fleet and property while remediating the properties we own.
- Capitalised overheads – This relates to the share of network and corporate overheads that are allocated to capital assets in accordance with accounting standards. This accounts for 20 per cent of forecast capex in 2024- 29, an increase of $16 million. This is due to a change in our allocation of overheads, which has resulted in a greater proportion of capitalisation.
We also are likely to include six contingent projects for uncertain but material projects including the construction of a Renewable Energy Hub to connect large scale renewable generation.
4.1 Forecast Method
In June 2022, we submitted our Forecast Expenditure Methods document to the AER. The document identified the approach we were taking to developing our forecast methods for capital expenditure. The capital forecasts put forward in this Draft Plan reflect this process, but we have still not implemented or finalised all elements of the forecast approach.
Our forecast methods have evolved considerably since the 2019-24 regulatory determination process. We have implemented feedback provided by the AER and stakeholders on applying risk quantification, modernising our demand forecast models and integrating top-down prioritisation into the development of our capital expenditure forecasts. We have also sought to undertake more analysis of long term needs of the network in a rapidly changing energy landscape. The purpose was to develop a credible forecast for the 2024- 29 period that aligned to the broader strategies identified in Chapter Three.
At a high level, there are three steps we will apply to developing the capital forecast expenditure for 2024-29, as seen in Figure 28.
- Identifying strategy – The starting point for our expenditure forecasts is to understand our changing environment over a longer- term horizon. Our strategy is informed by the feedback provided by our customers on values, vision and priorities for investment.
- Bottom-up plans – We identify key drivers of investment such as asset condition, growth in network usage, support from non-network assets, and overhead requirements. We then undertake needs and options assessment to develop a bottom-up list of projects and plans over a 10-year horizon.
- Top-down portfolio – A portfolio view helps identify the optimal mix of projects and programs that provide optimal value, align with longer term investment priorities and deliver customer preferences.
In our forecast method document we noted that the business case is the primary evidence we use to assess the veracity of our capital expenditure forecasts. We are currently still developing the full suite of business cases and we expect that this process may lead to differences in the estimates presented in this Draft Plan. We are mindful that checks are useful to ensure the portfolio can be further verified in terms of delivery and as points of comparison with other high-level models. We also consider that a prioritisation process may provide insights into the overall change in total risks. We plan to undertake a series of checks over the next six months including our deliverability.
Our overall approach carefully considered guidelines published by the AER including the Expenditure Forecast Assessment Guidelines and the Capital Expenditure Assessment Outline for Electricity Distribution. Our forecast method seeks to align to the guidelines. We also considered the AER’s Industry Practice Note on Asset Replacement Planning by applying its risk-cost assessment methods. We will also be presenting our ICT forecast to align with the approaches identified in the AER’s guidelines including presenting our programs in recurrent and non-recurrent categories.
Figure 28 – Capital expenditure Forecast Method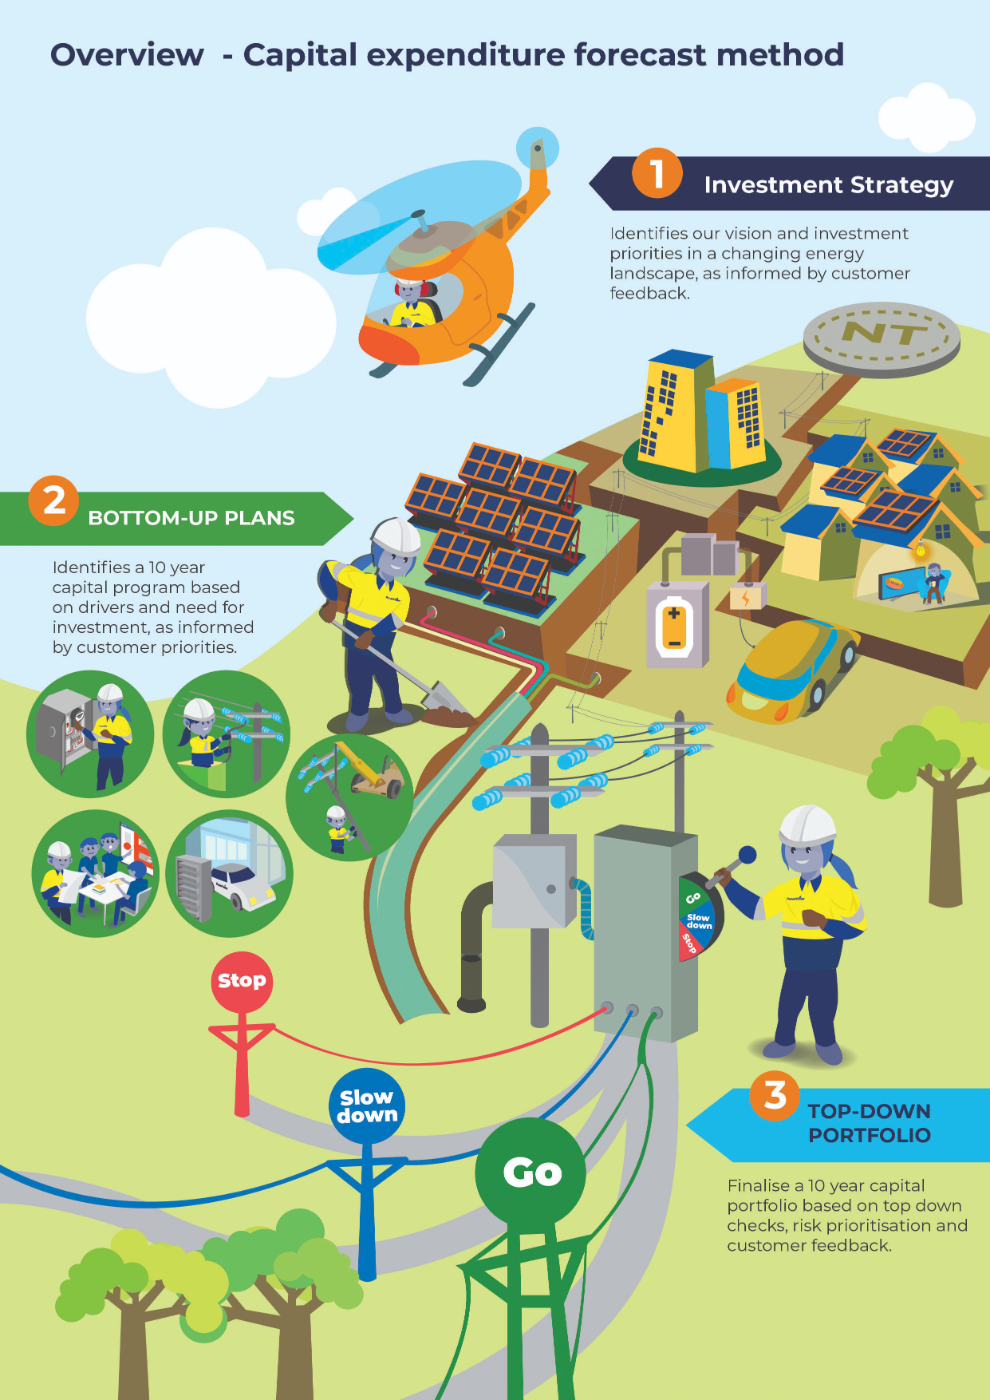
4.2 Drivers of capex
Capital expenditure is generally ‘lumpy’ responding to key drivers of investment at a point in time. Periods of high capital expenditure impact the affordability of electricity services due to an uplift in costs to finance more investments.
Figure 29 identifies capital expenditure in the 2024-29 period to actuals and estimates in the previous three regulatory periods. There has been significant volatility in capital expenditure over this period reflecting circumstances at the time.
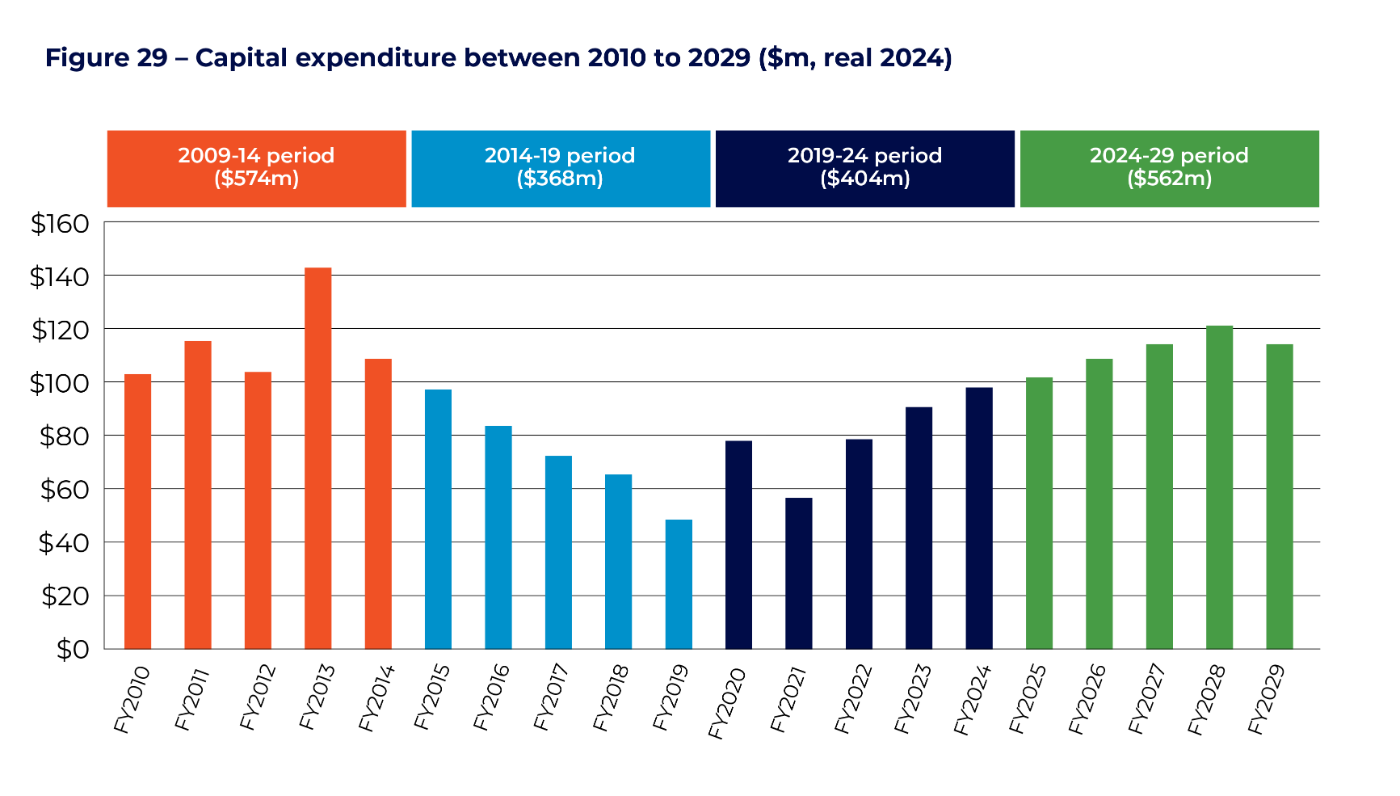
In 2008, the network suffered a major outage in Casuarina, that led to an external review of our network activities. The review showed that the network was in poor condition after sustained under-investment and maintenance. Reliability deteriorated significantly for customers over this period and as a result, we invested significantly in the 2009-14 period focusing on zone substations. The high capital spend in the 2009-14 regulatory period reflected a ‘catch up’ for under-investment in the previous years.
Capital investment fell in the 2014-19 period as we sought to reduce our costs. The reduction in capex was possible due to the improvement in the network and the relatively low number of older assets. Further, we did not invest in any new ICT assets. At the same time, peak demand started to flatten relative to historical levels as customers used their solar panels to meet energy needs. The combination of these factors meant our capital expenditure fell significantly during this period.
In 2019-24 we sought a moderate increase in capital expenditure. The key driver of capital expenditure related to an increased need for major replacement projects and programs, where asset data showed significant condition issues and high risks from failure of the assets. We project to be under the AER’s regulatory allowance by the end of the regulatory period. The key reasons for the underspend are:
- Deliverability issues in the first three years of our system capital program as we sought to uplift our capability and resources to deliver the capital program while encountering overlapping priorities.
- Re-prioritisation of our planned refresh of major ICT systems which led to the deferral of major projects. This was to ensure the program was targeted at highest priorities, and that the investment was efficient for a network of our small scale.
The implication of under-delivery is that the 2019- 24 expenditure level is not a relevant ‘baseline’ to forecast a ‘needs based’ expenditure profile.
In the 2024-29 period, we are forecasting significantly higher capital expenditure compared to actuals in the 2019-24 period. This is driven by five key factors discussed in the following sections.
- Managing renewables on the network
- Ageing assets
- Rising peak demand
As discussed in Chapter Three, a key pillar of our long-term strategy is to ensure the network can efficiently facilitate the expected acceleration of renewables in the grid. By 2040, there is a likelihood that the network may be required to transport 100 per cent renewable energy to our customers, increasing from the current NTG policy of 50 per cent by 2030. Our transmission network will need to expand to reach new large- scale renewables, while ensuring our network can securely manage exports of small-scale renewables.
As discussed in Chapter Two, investing in the future network was a key priority of our customers. Our 2024-29 forecast includes three key projects that relate to efficiently facilitating renewables – a new hosting capacity solution that can unlock more solar, community batteries to store solar in the day and discharge at night, and an Advanced Distribution Management System (ADMS) that will provide a longer-term solution to facilitating growing renewables post 2030. We also have a contingent project relating to the NTG’s plans for our transmission network to connect to a new large scale renewable hub south of Darwin.
A key theme in our customer feedback was that we should maintain our network and minimise the risk of reliability incidents experienced in the 2009-14 period. In our engagement sessions, we noted that replacement levels have been well below long term sustainable levels due to the relative youth of our network assets.
Over the next 20 years, we see that many of our assets will require replacement as they reach the end of their technical life. Unlike other places in Australia, most of our network was rebuilt after Cyclone Tracy in the short period after 1974. By 2030, a high proportion of these assets will be over 50 years old. Our asset management team have identified emerging issues with the condition of assets on the network that is prompting higher levels of replacement in 2024-29. As noted in Chapter Two, we have also listened to our customers’ preferences for smoother long term capital expenditure by forecasting a replacement fund to help the expected spike in replacement by 2040.
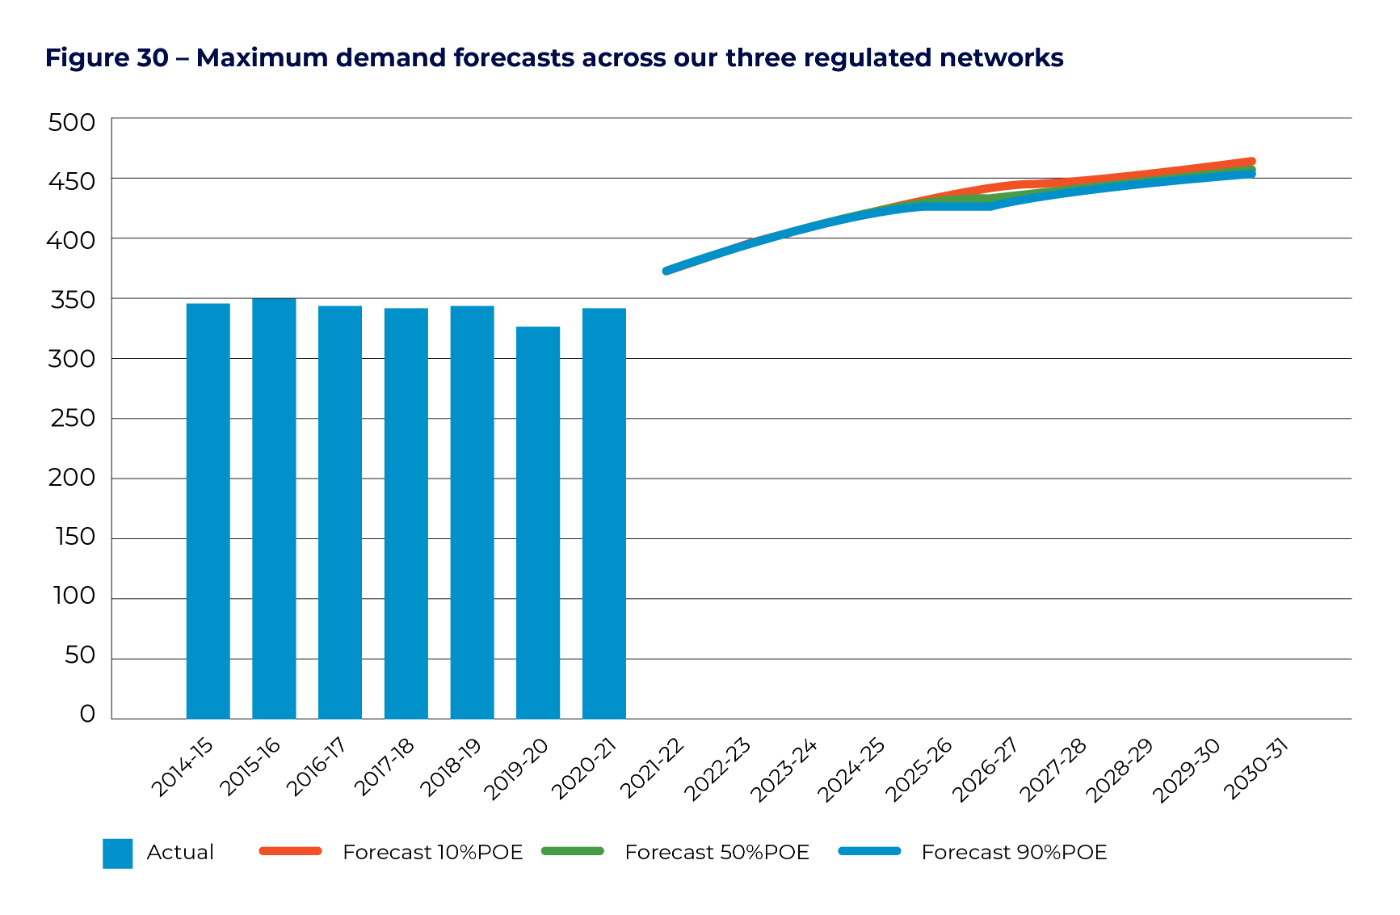
In recent years, we have seen moderate to falling peak demand growth at a system level, meaning that new network investment has fallen significantly. A key driver has been customers using their own solar to power their homes. A secondary driver has been relatively subdued economic activity which has led to slower growth in residential development and commercial connections.
Over the next decade, we are forecasting a significant increase in peak demand. We are seeing a significant increase in spot loads from residential and commercial developments, particularly in Darwin as seen in Figure 30. Our 2024-29 forecasts have assessed the impact of rising peak demand at a local level. In some cases, we are seeing high rates of growth in pockets of our network that exceed the capacity of the network.
As noted in Chapter Three, we see that peak demand could increase significantly after 2030 due to higher penetration of electric vehicles and increasing growth in the NT. Our longer-term strategy is to encourage customers to use energy when there is spare capacity on our network in the daytime through more efficient tariff structures.
- Continued refresh of our ageing ICT systems
- Uplift in delivery capability
Power and Water continues to operate ICT systems that were built a generation ago. In the 2019- 24 period, we expect to make some progress in implementing refreshed ICT systems including a new metering and billing system, and upgrading our Energy Management System. For the 2024- 29 period, we have undertaken further analysis of the pace and priorities of our ICT refresh. We have prioritised investments in an Advanced Distribution Management System (ADMS) which will assist us to meet the challenges of transitioning to a renewable energy system, while improving our outage management capabilities.
In our engagement sessions with customers, we discussed the factors that have resulted in lower delivery of capex than allowed by the AER in the first three years of the current period. While many factors have contributed, a clear reason has been overlapping priorities as we engage with a changing energy landscape.
At present, we are implementing an action plan that methodically seeks to increase our delivery capability. We recognise that implementation will take time, and our forecasts have therefore sought to defer some of the works required over the next three years into the 2024-29 period. We have sought to mitigate the additional risks, by prioritising major projects and programs.
4.3 Replacement capex
We forecast replacement capex of $224 million in the 2024-29 period, an increase of $87 million compared to the 2019-24 period as seen in Figure 31. The key drivers of higher capex include:
- As noted in the previous section more assets are approaching end of life in the next regulatory period, which has led to more identified condition issues.
- Consistent with our customers’ preferences, we have included a replacement fund of $28 million to assist us to smooth the expected steep incline in replacement between 2030 and 2040.
We categorise replacement activities into three types. Firstly, our planned replacement is for assets that we seek to replace or refurbish before they fail in service. These are assets that have a high consequence of failure in terms of safety, customer reliability, security, compliance or environmental impact. Secondly, we have assets which are scheduled for replacement based on a known defect. Scheduled replacements aim to replace or refurbish the asset before it fails due to moderate risk of consequence. Reactive replacements occur after an asset has failed in service. This would likely occur in cases where the risk is minimal or where the event was unlikely based on our regular maintenance data.
As noted in section 4.1, a key improvement to our forecast approach for replacement is a new risk quantification approach to consistently appraise the costs and benefits of investments. This is a relatively new approach for Power and Water and follows extensive feedback from the AER in our last proposal. By providing a quantitative basis for valuing risks, we can more consistently consider needs across the capital portfolio.
We identify the probability of a risk occurring, and the consequence such as safety, reliability, environment and other factors consistent with our Enterprise Risk Management Framework. Such an approach allows us to defer investment and improve affordability where the risks can be managed appropriately. The key values in our new approach include health and safety of workers and the public, compliance, direct financial costs, environmental, service delivery and customer experience. Each of these values have a dollar impact based on whether the consequence is insignificant, minor, moderate, major or severe. The risk is measured as the probability of the event occurring, multiplied by the likelihood of a consequence from the event multiplied by the value of that consequence.
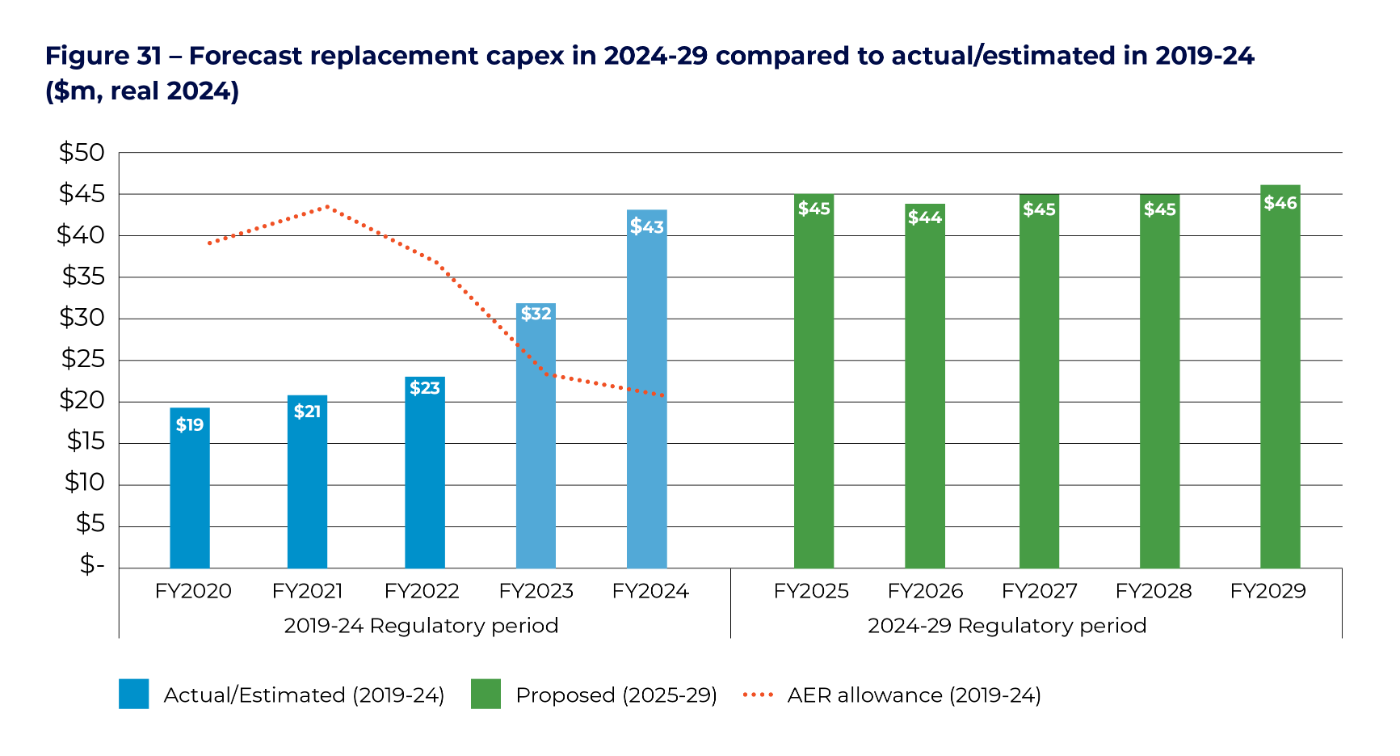
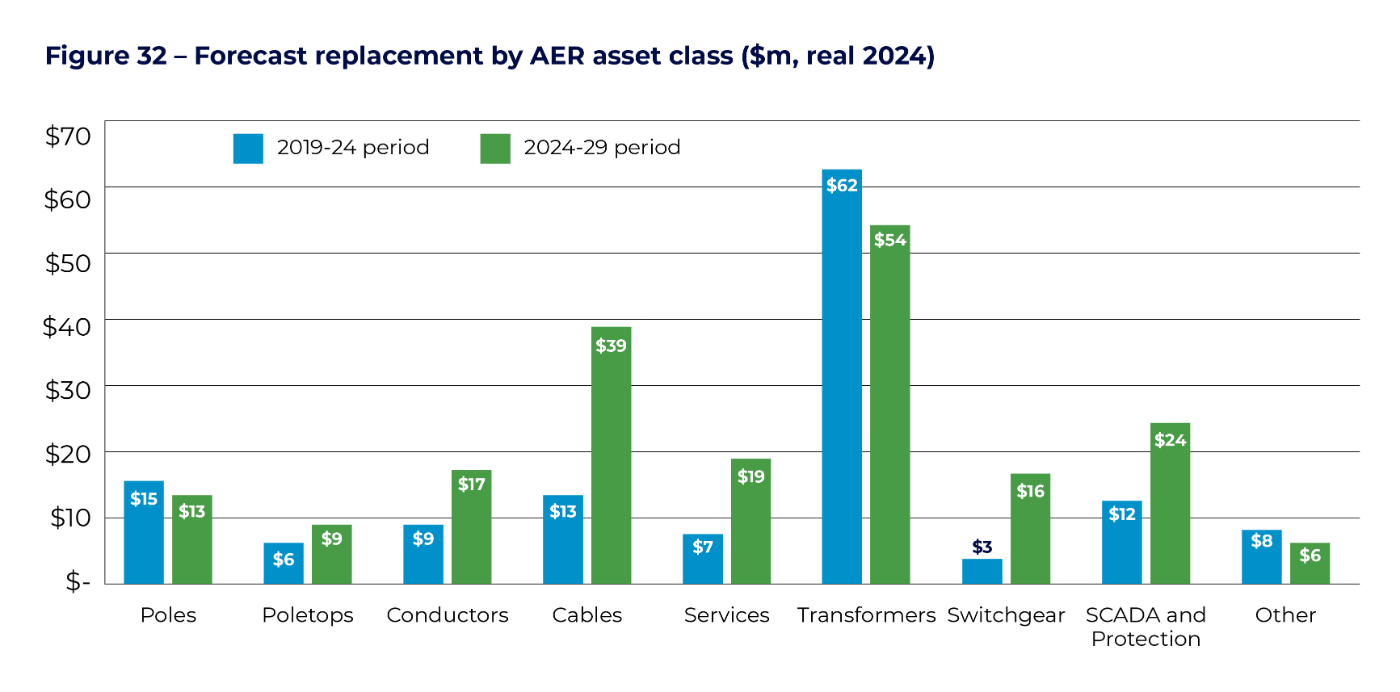
Figure 32 provides a breakdown of the forecast replacement program for 2024-29 compared to the 2019-24 period. The areas of significant increase are cables, services and SCADA and protection. The increase in cables reflects the lower delivery of the Northern Suburbs cable program than in the AER allowance in the 2019-24 period, and the deferral of the Port Feeder project to the 2024-29 period. The increase in services reflects a new planned program to replace assets in poor condition and which are expected to require replacement in the 2024-29 period. SCADA and protection replacement relates to obsolescence issues we are experiencing with these assets as they approach end of life.
The major replacement projects and programs included in the 2024-29 proposal include:
- Darwin Northern Suburbs high voltage cable program ($27 million) – The program has already commenced and will uplift from 2022 to 2024 where we will replace about 40 kilometres a year and replace about six kilometres each year from 2025 to 2030. Due to the location of the cable on the coast, the sheath of some segments is damaged, allowing water ingress which has caused deterioration of the cable’s internal components. The corroded screens will increase the risk of electric shock and adversely affect our protection systems. This exposes our workers and the public to safety risks.
- Alice Springs network optimisation ($17 million) – Four of the transformers at two zone substations are approaching end of life based on testing of residual insulation strength. At this stage we are also assessing the 11 kV switchboard at Lovegrove and 22 kV switchboard at Sadadeen, both of which will be 42 to 44 years old in the planned year of replacement and have known defects. All associated protection and SCADA are also forecast to be replaced.
- Humpty Doo transformer replacement ($10 million) – There are condition issues with the assets within the zone substation including the 66kV circuit breaker which has a history of failures associated with the operating arm, and the power transformers which have an excessive level of moisture in the paper insulation largely due to significant continuous oil leaks. There are also condition issues with the 22kV switchgear including gas leaks, and the secondary systems are obsolete and spares are difficult to source.
- Alice Springs corroded poles ($8 million) – The major targeted program for pole replacement and refurbishment is in Alice Springs. The poles are corroded from high salinity and moisture levels in the soil. We plan to replace and refurbish about 200 poles each year for the next decade. This causes structural integrity issues leading to safety risks to the public and our field crews if the pole falls. We will be targeting replacement and refurbishment of the poles that are in the worst condition and pose highest risk to the community. The project will be ongoing for the next decade due to the high volume of degraded poles.
4.4 Growth capex
We forecast $115 million on augmenting the network and connecting customers to meet new demand for our network services (”growth capex”) in the 2024-29 period, an increase of $69 million compared to the 2019-24 period as seen in Figure 33. The primary drivers of the increase in capital expenditure include:
- An increase in demand on local areas of our network from residential and commercial development that requires new network infrastructure.
- A forecast doubling of small-scale solar installation by 2030, which necessitates a hosting solution to safely export our customers solar without imposing strong export constraints.
We have made significant improvements to our methods to forecast demand for energy and solar exports over the last year to give us an improved understanding of when the network needs to be upgraded. Our new method involves a more granular analysis of historical trends and drivers of change. We have also improved our method for estimating the expected load and timing of new large connections.
Similar to our replacement program, we will be assessing investments against our risk quantification methodology. This includes identifying the value of customer reliability when considering upgrades to the capacity of the network.
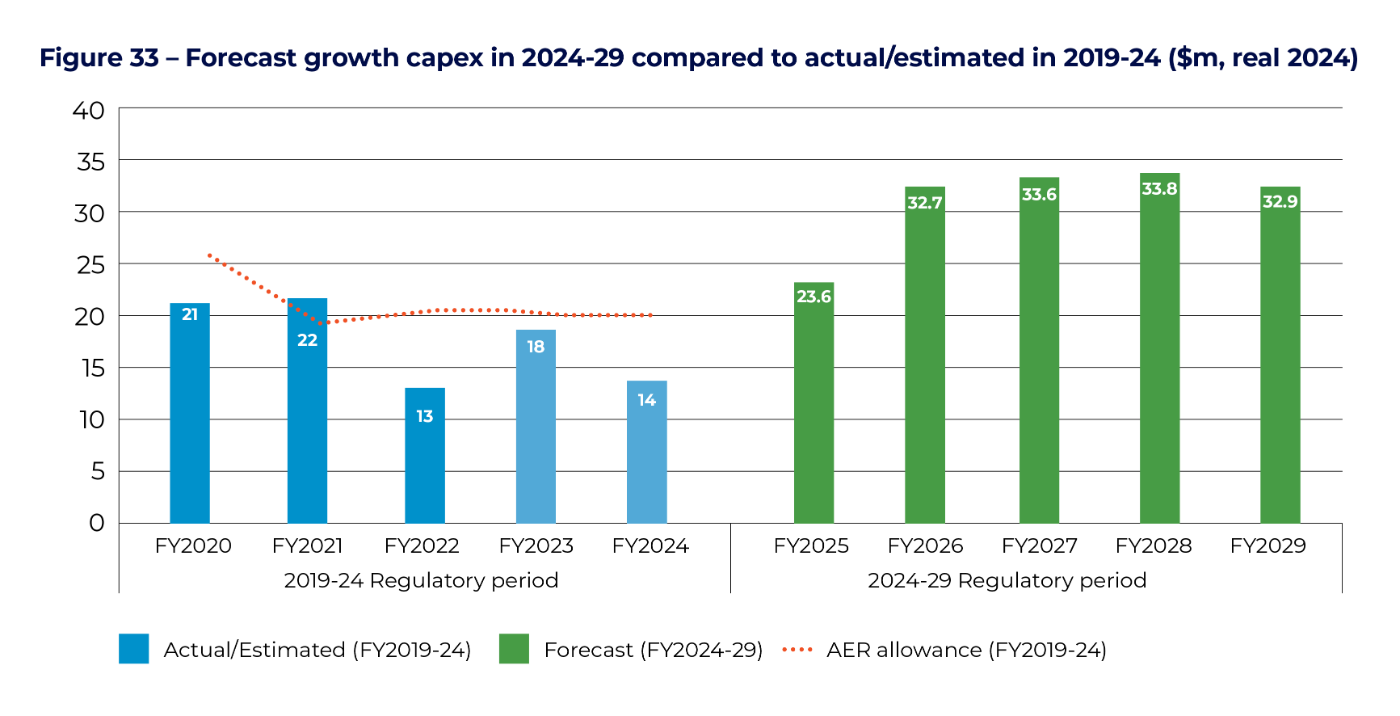
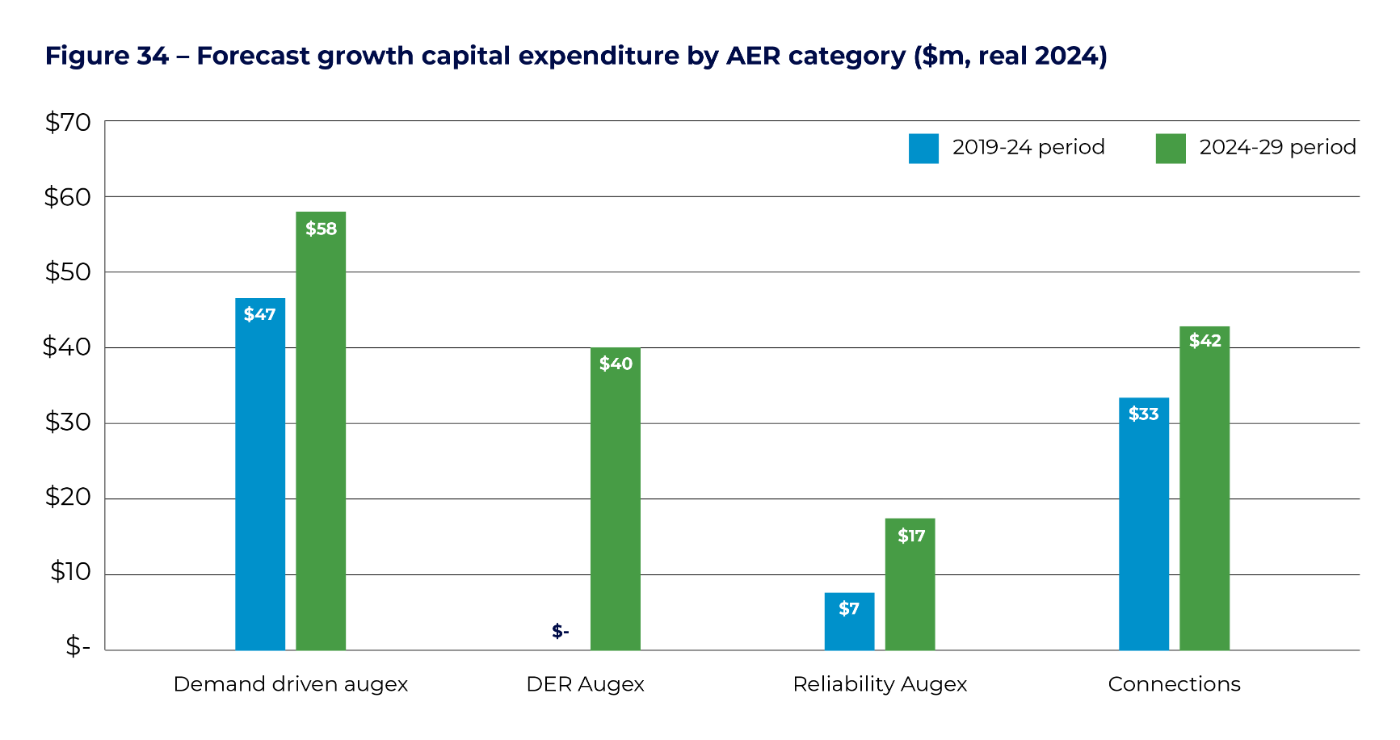
Figure 34 sets out forecast growth capex program by AER categories. Demand driven capex relates to investing in new infrastructure to meet higher peak demand for electricity in sections of the network and accounts for $58 million. This includes a major project to upgrade Katherine zone substation, and a series of minor programs and projects. Investment in our future networks program (termed DER augex) is a new type of investment and accounts for $40 million to address challenges we expect to face with exporting higher amounts of household solar. Reliability augex is increasing to $17 million as we seek to ensure we meet voltage performance targets, while continuing to meet our obligations to improve performance for customers who receive poor service.
Connections capex relates to new infrastructure for an individual customer. Connections capex is forecast to increase to $42 million in the 2024- 29 period, largely due to an increase in large connections. We apply a connection policy to determine the capital contribution that a customer makes to the connection costs. We are proposing to make changes to our connection policy including expanding the connection policy to include export and simplifying the capital contributions process by linking it to the threshold for basic connection services.
Connections capex relates to new infrastructure for an individual customer. Connections capex is forecast to increase to $42 million in the 2024- 29 period, largely due to an increase in large connections. We apply a connection policy to determine the capital contribution that a customer makes to the connection costs. We are proposing to make changes to our connection policy including expanding the connection policy to include export and simplifying the capital contributions process by linking it to the threshold for basic connection services.
A key change for our customers in relation to connection services is how negotiated connection services will be classified in the 2024-29 period, which has flow on effects in terms of how these costs are charged and recovered. As part of its decision in its Framework and Approach, the AER classified negotiated connection services as an alternative control service. This means that customer connections that fall within the definition of a negotiated connection in our connection policy will now see a cost reflective price for their connection than under previous arrangements where they only paid a small portion of their true costs upfront.
The major growth projects and programs in the 2024-29 forecast include:
- Katherine zone substation upgrade ($22 million) – The zone substation is already overloaded under a single critical contingency (N-1) of a transformer failure. In the short term, we are considering lower cost options to support load if one of the transformers fail, such as batteries or an agreement to supply additional load from a local generator. In the longer term, we see the need to upgrade the capacity of the zone substation as load continues to increase. Large housing developments and commercial loads are forecast to locate to the east of Katherine. This means that the load at risk will become significantly higher and a longer-term solution will be required. At this stage, we consider the least cost feasible option to address the long term need will be to upgrade the existing zone substation.
- Future Network Hosting and Community Batteries ($40 million) – As discussed in section 2.4, our People's Panels considered we should implement a technology solution to help the network export more household solar without building new infrastructure. The People's Panels also wanted us to pursue two community batteries that would store excess solar produced in the day and discharge the energy in the night during the peak evening period. We are currently in the process of analysing the need, options and benefits with consideration to recent AER guidelines on the cost of curtailed exports. At this stage, we have provided a rough estimate of $40 million to help inform our stakeholders on the materiality of the initiatives.
- Install reactors at Katherine zone substation ($8 million) – Quality of supply relates to voltage disturbances that can impact a customer’s energy supply and appliances. Katherine is significantly above the limits for a significant proportion of the time. To address this issue, we will be installing switched inductive compensation to lower voltage at the bus in the zone substation, which will have the impact of absorbing reactive power.
- Uprating transmission lines in Darwin ($5 million) – We have undertaken contingency analysis of our transmission lines to identify if any lines would exceed capacity. Under a critical contingency (N-1) on the line from Hudson Creek to Palmerston zone substation, the 66kV line is expected to exceed capacity by the end of the decade. Similarly, under a critical contingency on the line from Hudson Creek to Archer zone substation, the 66kV overhead line from Hudson Creek to Palmerston line is expected to significantly exceed capacity by 2029-30. The two options to address the overloads under N-1 include procuring additional generation at Weddell power station and uplifting the line ratings from 64MVA to 90MVA for each of the lines.
4.5 Non-network and overhead capex
We forecast $182 million in total on non-network ICT, non-network other, and capitalised overheads in the 2024-29 period, an increase of only $1 million compared to the 2019-24 period as seen in Figure 35.
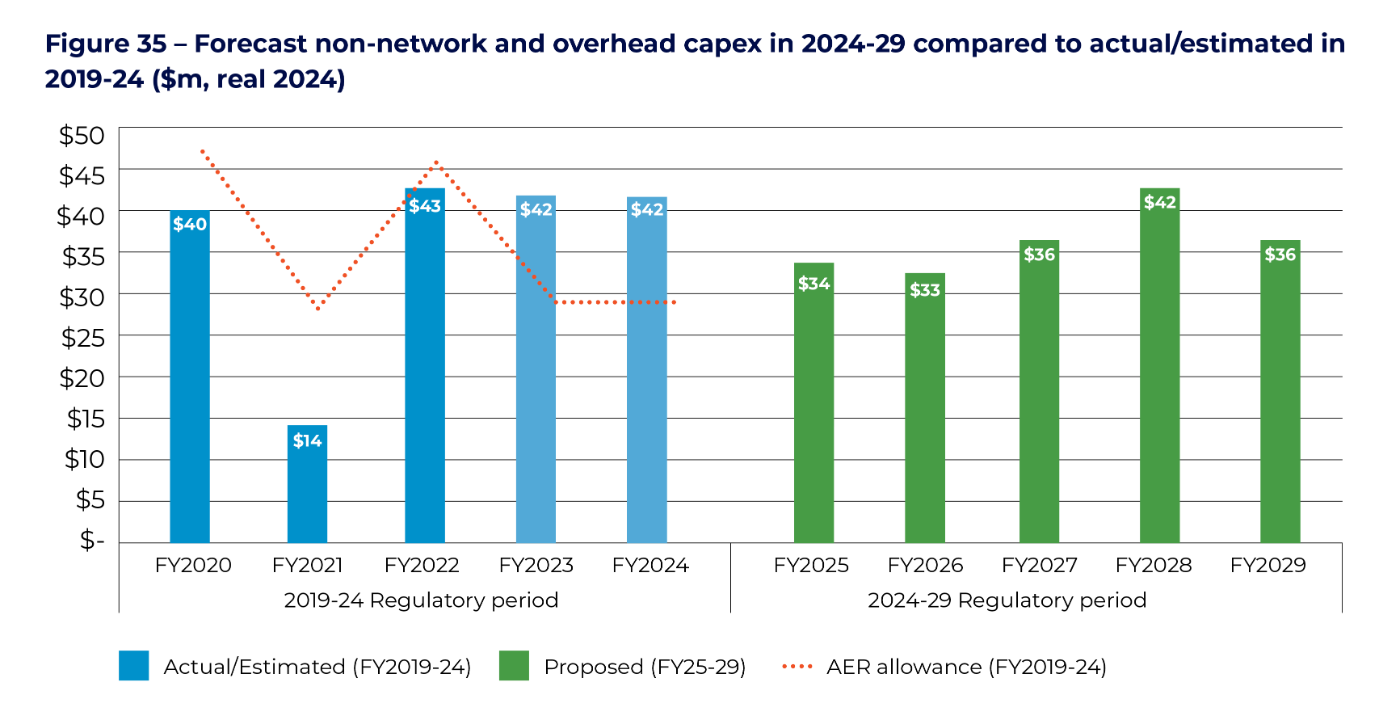
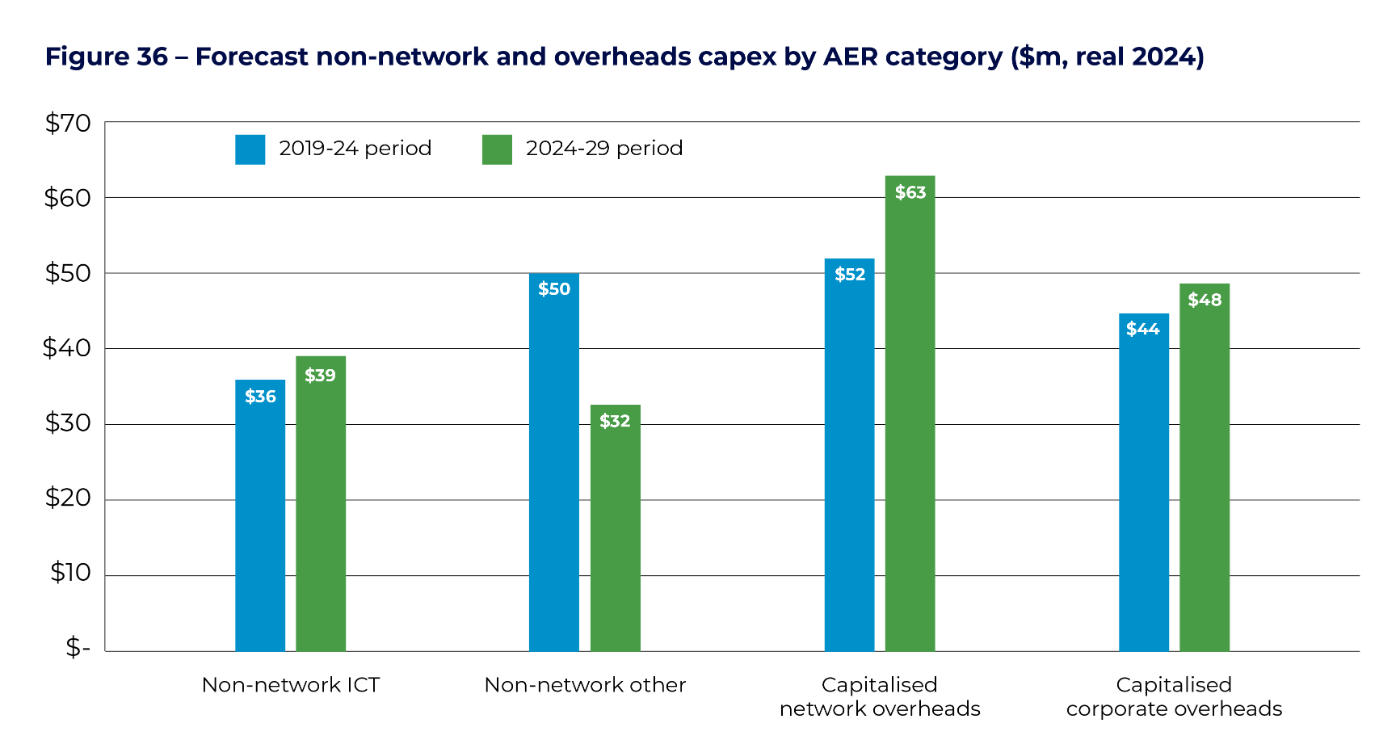
Figure 36 provides a breakdown of the forecast in the 2024-29 period by AER category compared to the 2019-24 period. Non-network ICT is at similar levels to the current period, and non-network other is forecast to be significantly lower. Overheads are increasing compared to the current period.
About 85 per cent of the forecast ICT capex relates to refreshing our major ICT systems, many of which are losing currency and functionality. About 15 per cent of ICT is for maintaining the currency and cyber security of our existing assets. As a multi- utility, we allocate a portion of the total capex of ICT systems to standard control services in accordance with our Cost Allocation Method.
We commenced our ICT refresh journey in the 2019-24 period, with the expected completion of our meter and billing system and upgrade to our Energy Management System by the end of the period. We have significantly re-prioritised our ICT refresh program compared to our regulatory proposal, taking a more cautious and prudent approach to investing in large ICT systems.
We commenced our ICT refresh journey in the 2019-24 period, with the expected completion of our meter and billing system and upgrade to our Energy Management System by the end of the period. We have significantly re-prioritised our ICT refresh program compared to our regulatory proposal, taking a more cautious and prudent approach to investing in large ICT systems.
This has meant that some of the systems we had initially intended to commence in 2019-24 will now occur in the 2024-29 period including a new Asset Management , Mobility and Capital Delivery system and the Physicals to Financials ICT systems. These systems will be vital to implement given our expected ramp-up in capital expenditure over the next 20 years as we replace ageing Cyclone Tracy assets.
Property leases account for about $9 million of non-network other capex, and largely relate to the expected costs of leasing our existing commercial properties including the Mitchell Centre. We also expect to incur about $7 million on refurbishing our depots to address non-compliance and remediate sites. Fleet leases account for $12 million of non-network capex.
Property leases account for about $9 million of non-network other capex, and largely relate to the expected costs of leasing our existing commercial properties including the Mitchell Centre. We also expect to incur about $7 million on refurbishing our depots to address non-compliance and remediate sites. Fleet leases account for $12 million of non-network capex.
4.6 Contingent projects
In developing our capital expenditure forecasts, we have identified a number of large projects, projected to cost in excess of $15 million each, which may be required during the 2024-2029 period but which are highly uncertain in terms of timing, scope or funding arrangements. The regulatory framework requires that these projects be excluded from the forecast capital allowance, and separately identified as a contingent project. If a contingent project is allowed by the AER, we would need to demonstrate that a ‘trigger’ has occurred and that our capital expenditure is prudent and efficient.
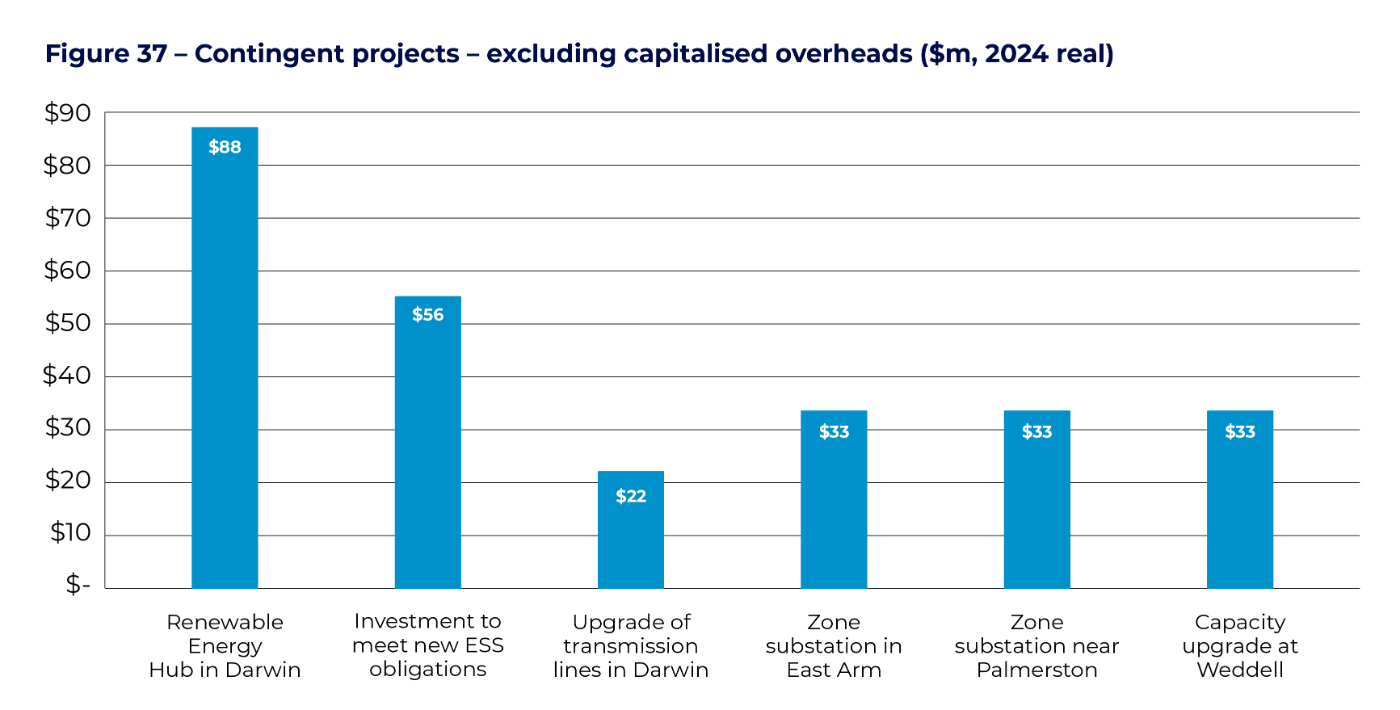
The relatively high number of contingent projects reflects the uncertainty over the likelihood or timing of large projects in the NT including the development of renewable hubs, land releases and large industrial hubs. If these projects were to arise during the 2024-29 period, our revenue would increase from the estimate presented in the Draft Plan. It is therefore crucial that our stakeholders understand the nature of these projects. The estimated capital expenditure if these projects proceed are set out in Figure 37 and include:
- Renewable Energy Hub in Darwin – The NTG’s Darwin-Katherine Electricity System Plan includes a Renewable Energy Hub where large scale solar and battery will connect to available capacity on our transmission network. This will require the construction of new transmission infrastructure and a sub-transmission substation. We are working with the Northern Territory Government to understand our role in the implementation of the initiative.
- Investment to meet new ESS obligations – Under the proposed NTG Essential System Strength framework, we have obligations to maintain local system strength. Depending on the scope of the obligation, this may necessitate large investment such as a synchronous condenser.
- Upgrade of transmission lines in Darwin – While not committed, we expect a significant increase in demand in east rural and south Darwin. This may require a larger upgrade to the planned replacement of the zone substation and may require additional transmission infrastructure.
- Zone substation in East Arm – A new zone substation is likely to be required to meet industrial growth in East Arm. However, there is uncertainty on the timing of connections to the area.
- Zone substation near Palmerston – The Government’s land plan contemplates a new urban district in Holtze, near Palmerston that would necessitate the construction of a new zone substation in the area. However, no firm commitments are in place at this stage.
- Capacity upgrade at Weddell – This would meet the expected demand from industrial developments at the Middle Arm Sustainable Development Precinct.