3. Strategic priorities
Our small network will be subject to significant global and local changes that impact the way we deliver electricity to our customers over the next 20 years. We have identified key long-term strategic priorities that have influenced the development of our five-year expenditure, revenue and tariff plans. Our customers’ vision and priorities have played a pivotal role in shaping these priorities.
We are living in a period of unprecedented and rapid change. Our small network is being disrupted by global trends from climate change to market uncertainty. At a local level in the NT we are also facing a myriad of change factors in the years ahead from the need for a significant uplift in replacement of network assets to meeting the demand needs of a growing NT. This is reflected in Figure 19.
The global factors include:
- Responding to climate change – Climate change has accelerated the need to switch to renewable energy, impacting the way our network delivers energy to our customers. The impacts of climate change will also impact reliability of our services, with more extreme weather events such as cyclones requiring a greater need to make the network more resilient. We also see that increasing extreme heat days may lead to more extreme peak days as customers use more air conditioning.
- Electrification of transport – The shift to electric vehicles will significantly increase consumption and demand for electricity in the NT. This will also impact the time, seasons and locations where energy is required to be delivered from our network depending on when and where customers charge their vehicles.
- Financial uncertainty – During recent times of low interest rates, our customers have benefited from a reduction in our costs to finance our investments. However, financial conditions are currently volatile with high inflation likely to result in higher interest rates. Disruption to supply chains together with higher inflation are also likely to lead to higher input costs for delivering our services.
In respect of local factors we see three drivers of change:
- Replacement wave – Unlike other states and territories, a significant proportion of our asset base was built following the aftermath of Cyclone Tracy in 1974. This means that inherent reliability will likely decline as our assets age beyond their standard life. To maintain reliability, we will likely need to increase our replacement well above today’s levels which will have a consequent uplift to our costs.
- Refresh of ageing ICT system – With the exception of our metering and billing systems, our existing fleet of ICT systems have not been refreshed for a generation. This impedes our ability to transform efficiently as a business and to deliver modern services required by our customers.
- Growing NT – The Northern Territory Government has set an ambitious goal of achieving a $40 billion economy by 2030. We note that many major infrastructure projects have already been announced. We also anticipate increasing connections from large users over the coming years will impact on network demand and may trigger the need for targeted investment in particular parts of Power and Water’s network to accommodate increased demand for network capacity.
Figure 19 – Changes impacting our network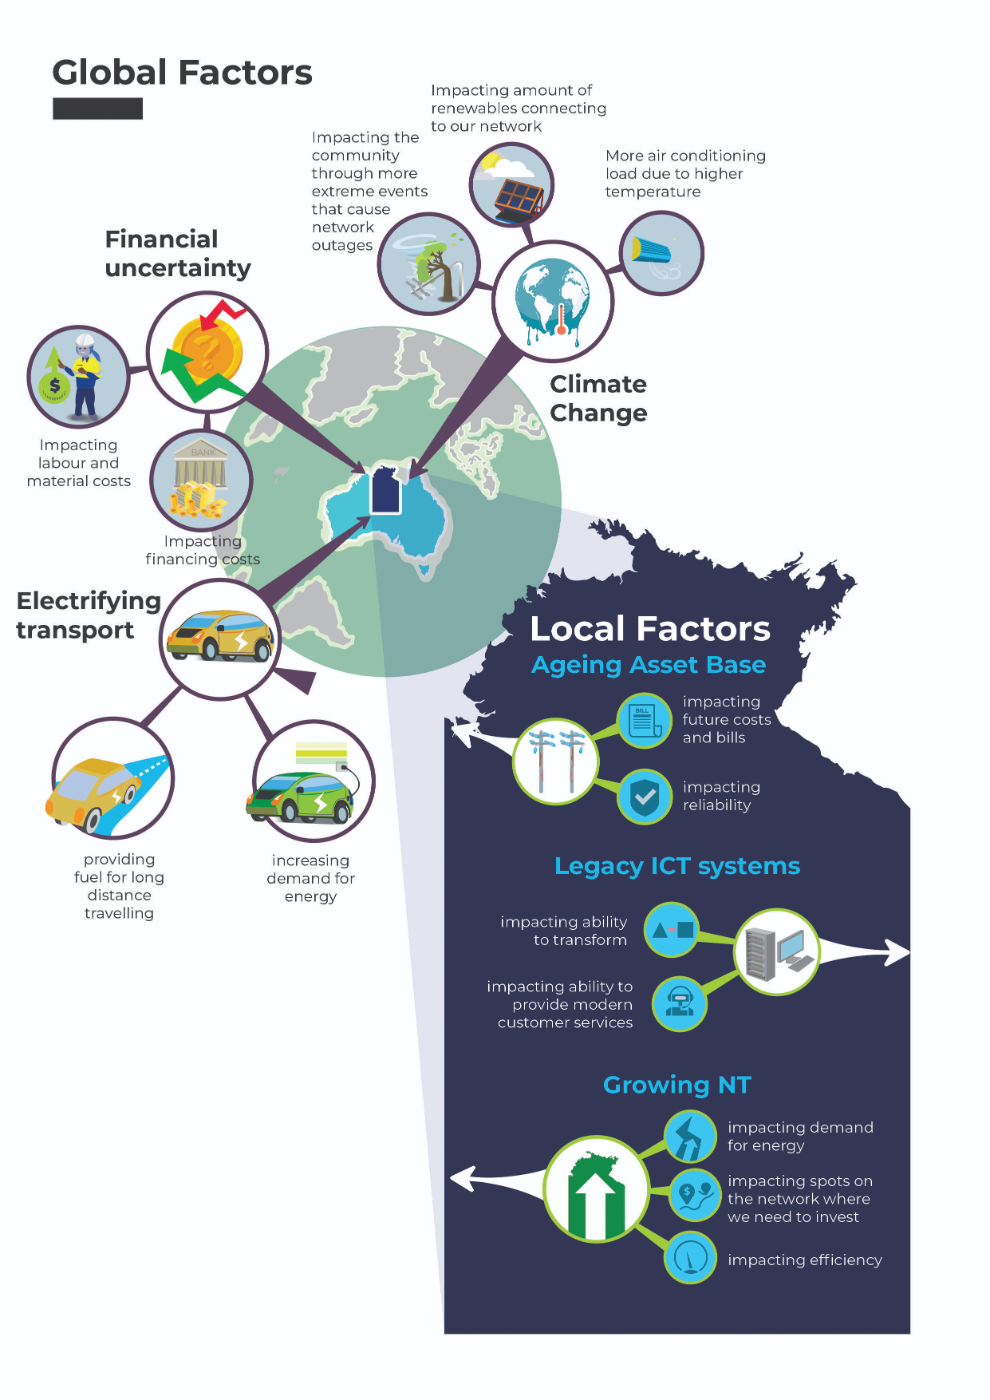
In response to global and local drivers, we have identified four key strategic priorities for the next 20 years. These strategies have influenced the development of our five-year expenditure plans.
3.1 Strategic Priority One – Facilitating renewables
Under NTG policy, we expect that 50 per cent of energy consumed will come from renewable generation by 2030. Approximately 30 per cent will come from large scale renewables that connect through our transmission network. About 20 per cent is expected to come from roof top solar connected to our smaller customers’ houses and exported back into the grid.
This presents engineering challenges for the design of our network. For the transmission network, we will need to build lines to connect generation located in different areas to the current thermal generation stock, and ensure that the network can securely transport the renewables to the load centres. For our distribution network we will need to manage voltage and minimum demand challenges from two-way flow of exports.
While there are challenges ahead, we also see great potential benefits from unlocking renewables in the NT. Our current electricity system is predominantly powered by gas, which is a relatively costly fuel source. In contrast, solar is abundant in the NT and the technology is significantly less costly than gas. Building a network that can facilitate large scale transmission and household exports can provide lower generation costs for all customers that outweighs new expenditure on the network.
We also see that playing our part in decarbonising the globe will help avoid catastrophic environmental changes that will impact us here in the NT. Abating the impacts of climate change will mean spending less on making our network resilient in the face of cyclones and extreme heat.
A key theme in our engagement with customers has been the need for Power and Water to facilitate a renewable energy system in the NT. We have responded by developing a Future Network Strategy with the purpose of ensuring our network can eventually facilitate net zero.
In June 2022, we held a second Future Network Forum which discussed the development of our strategy to 2040. Figure 20 provides an overview of the timeline and plan. The plan discusses three key phases to facilitate higher levels of small scale renewables. The Empower stage is about increasing export capacity using existing tools while building the systems and visibility of the network. The Evolve stage is about activating exports through a smaller scale dynamic export solution, where the network can send out signals to ramp up and ramp down exports based on real time constraints. The Decarbonise stage is about scaling up our systems and solutions to unlock exports to meet a 100 per cent renewable target if required.
Figure 20 – Future Network Strategy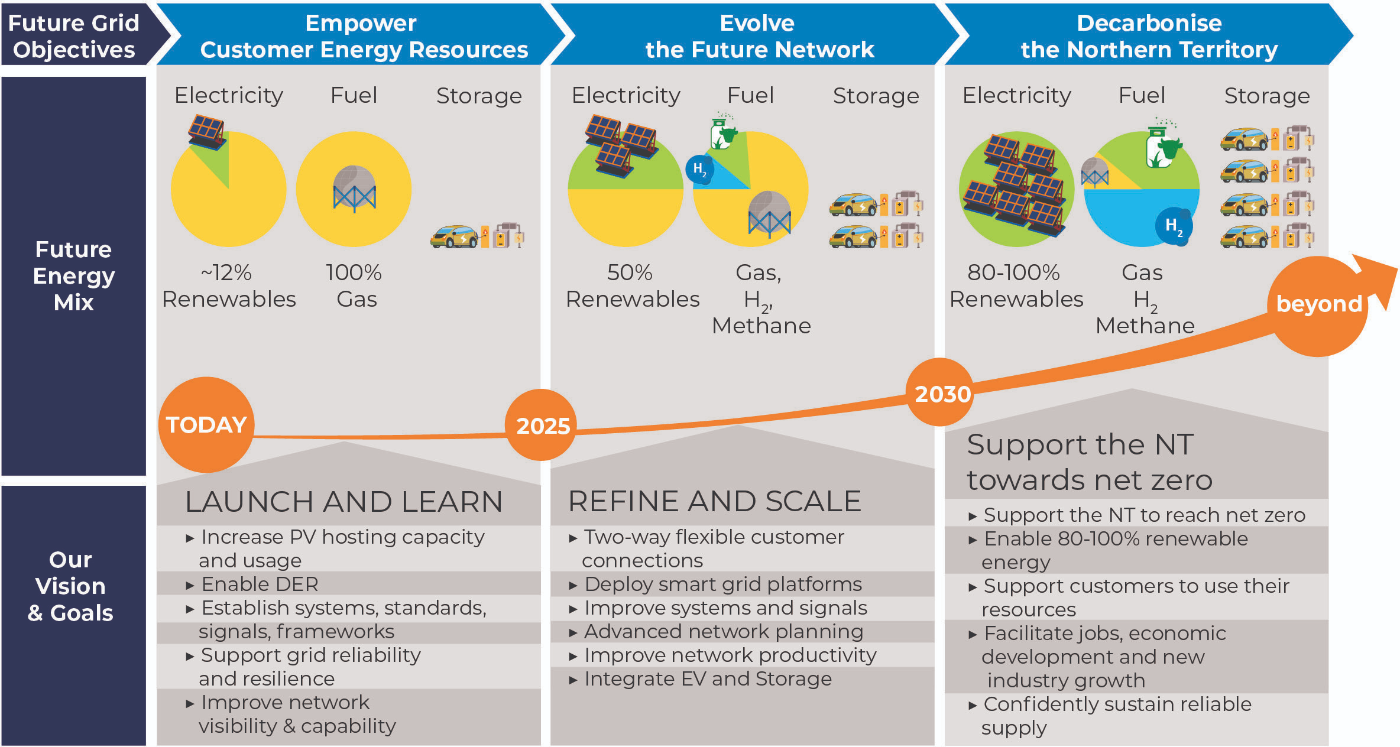
Connecting renewables to our transmission network at least cost
The first element of our strategy is to design the transmission network to connect new large-scale renewables at lowest cost. This has the benefit of reducing our long-term transmission costs and improving affordability for all customers. The key to lower costs is for generators to locate close to existing transmission infrastructure with spare capacity as seen in Figure 21. For this reason, we strongly support the concept of a Renewable Energy Hub identified in the Darwin-Katherine Electricity System Plan.
The renewable hub is still in an implementation phase so there is not sufficient clarity on costs, timing or scope to include in our capital expenditure allowance at this stage. Under the regulatory framework such projects are excluded from the allowance, and included as a contingent project. We discuss this further in section 5.6. While we see the Renewable Hub as increasing our network costs in the 2024-29 period, we note the NTG’s analysis which shows it unlocks lower generation costs in the electricity system.
Beyond 2030 we expect even more large-scale renewables to connect and deliver higher levels of energy to support growing demand. This means the transmission landscape is likely to become complex in the future and may require expansion. We consider that transmission costs are likely to be minimised through more Renewable Energy Hubs that allow for centralised, rather than piecemeal expansion of the transmission network.
Figure 21 – Renewable hubs for large-scale generation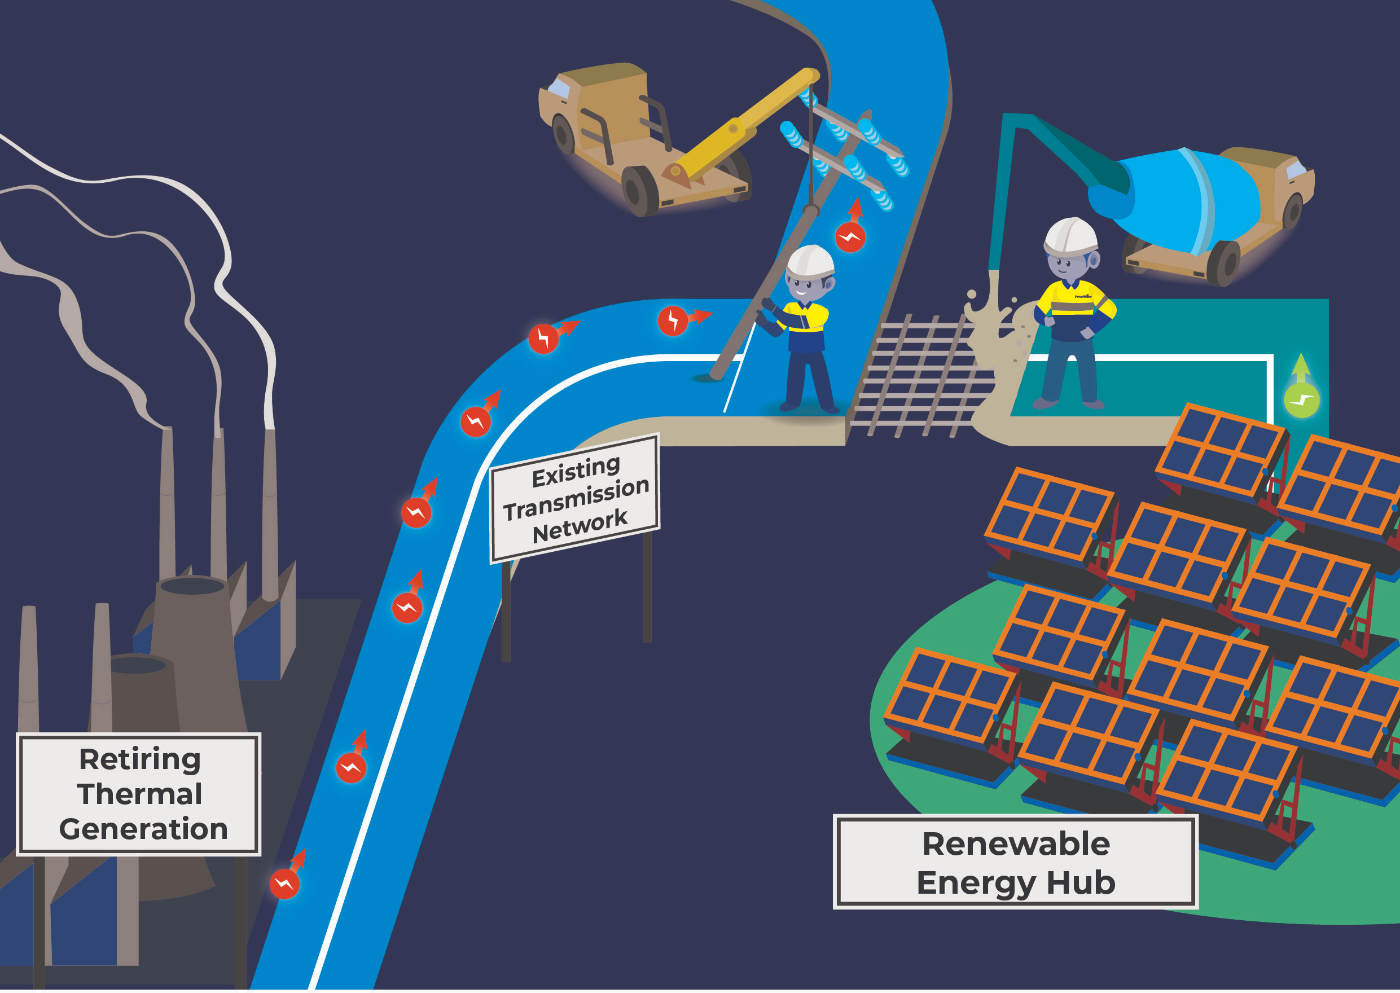
Cost effectively unlock small scale renewables
In its current design, the network will not be able to securely export all of the forecast generation from rooftop solar due to voltage and minimum demand challenges.
This adversely impacts on customers installing new solar who cannot maximise their investment. It is also a lost opportunity to reduce generation costs for all customers as solar has significantly lower cost than thermal generation.
The core of our Future Network Strategy has been finding solutions that unlock small scale renewables at low cost, where we can demonstrate a net economic benefit to customers. Key strategies in our Future Network Strategy that draw on our customer preferences include increasing solar exports by getting a better understanding of the voltage and thermal limits on the distribution network, and storing solar energy in home and community batteries for discharge in the peak evening periods.
Figure 22 provides a visual of dynamic operating envelopes working in a similar way to dynamic speed limits. In the figure, the hosting solution is depicted as robots that sense when the network is outside of safe voltage and thermal limits and seeks to reduce the speed of exports. At times of constraint, power can be stored in community batteries and discharged in the evening peak period.
Figure 22 – Unlocking household solar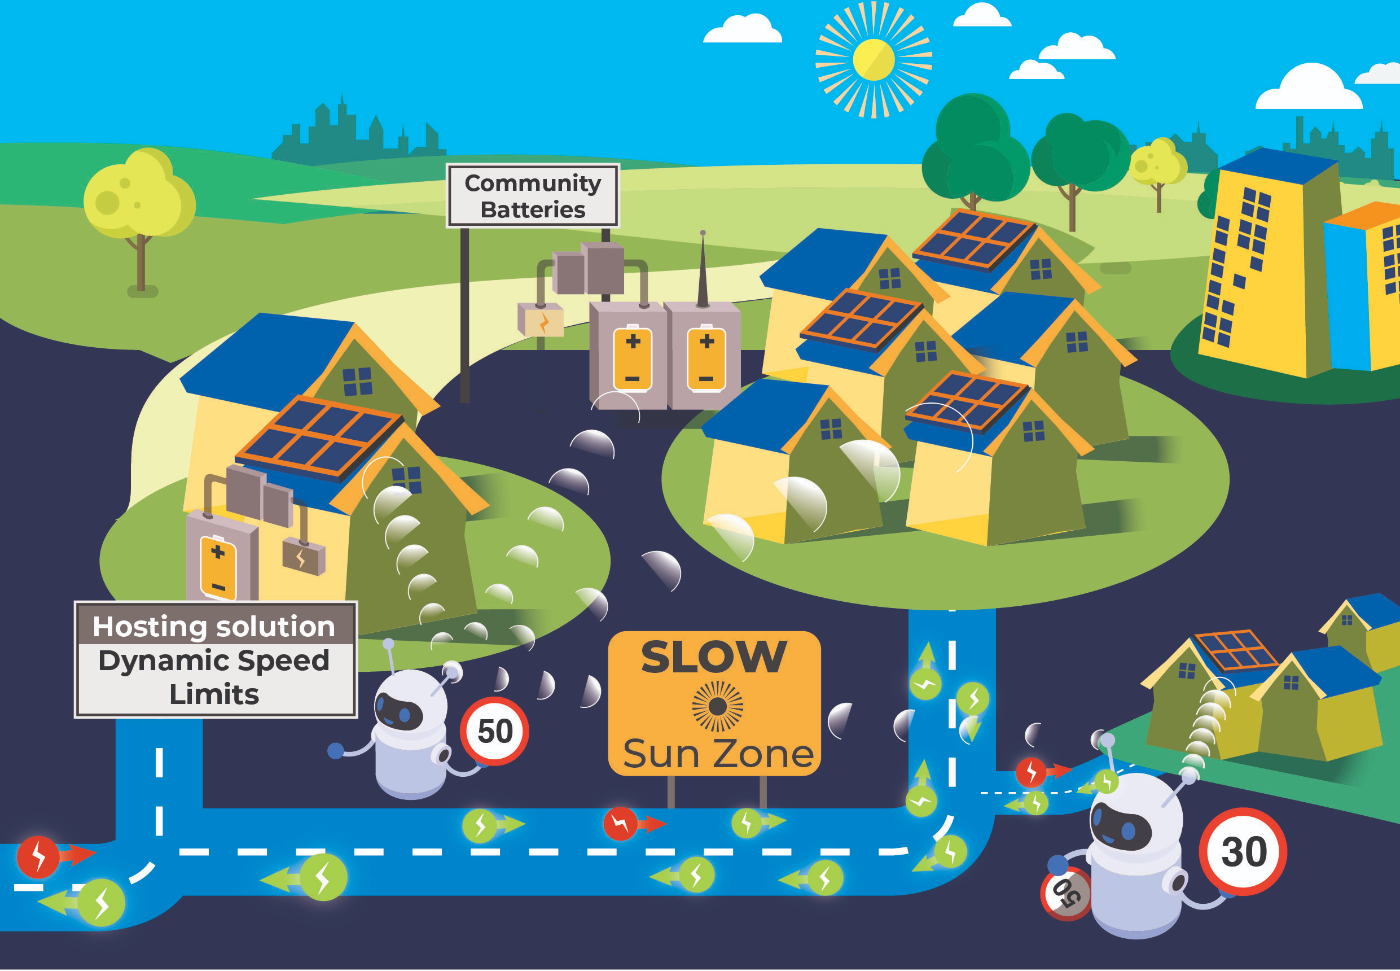
3.2 Improving utilisation
One of the keys to unlocking affordability is providing more power to customers while minimising new expenditure.
A key strategic priority is to encourage new and existing customers to use electricity in off peak periods that coincide with low cost solar. Early analysis shows that electric vehicle charging times are one of the key levers to improving utilisation beyond 2030. A further strategy is to see if storage batteries can also be used to store excess solar in the day and discharge in the evening peak.
A key strategic priority is to encourage new and existing customers to use electricity in off peak periods that coincide with low cost solar. Early analysis shows that electric vehicle charging times are one of the key levers to improving utilisation beyond 2030. A further strategy is to see if storage batteries can also be used to store excess solar in the day and discharge in the evening peak.
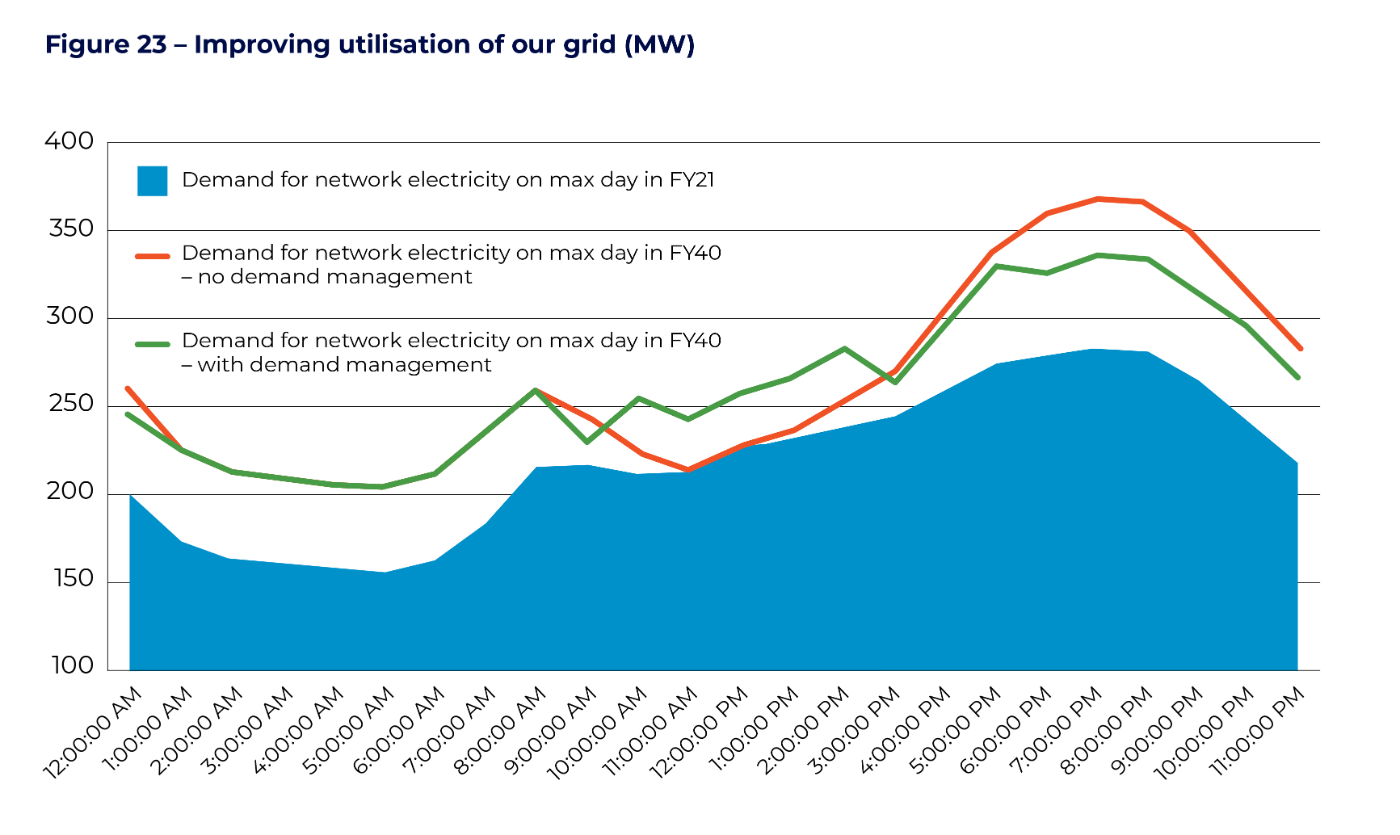
Figure 23 shows there was a sharp peak in the evening period on the day of highest demand in the Darwin-Katherine network in 2020-21. In contrast, demand for our network service is minimal in the day when many of our customers are using their solar panels to provide their electricity.
We undertook analysis on how peak demand would change by 2040 under a scenario where there was a 30 per cent increase in underlying demand, a doubling of solar capacity and no change in underlying daily demand patterns. The orange line shows that peak demand would significantly increase to 370MW by 2040. This would require significant new investment to meet the demand. At the same time, demand in the middle of the day would not have significantly increased due to customers using their own solar to power homes. Alternatively, if about 10 per cent of energy at peak times is shifted to the middle of the day, we see that peak demand will rise closer to 330MW. This will lead to significant reductions in our new growth capital expenditure in the future.
3.3 Managing the health of our assets smoothly over time
A key strategic priority for Power and Water is safely maintaining the reliability of the network as assets age over the next 20 years while minimising cost and price spikes for customers. This has been a key theme in our engagement consultations with customers.
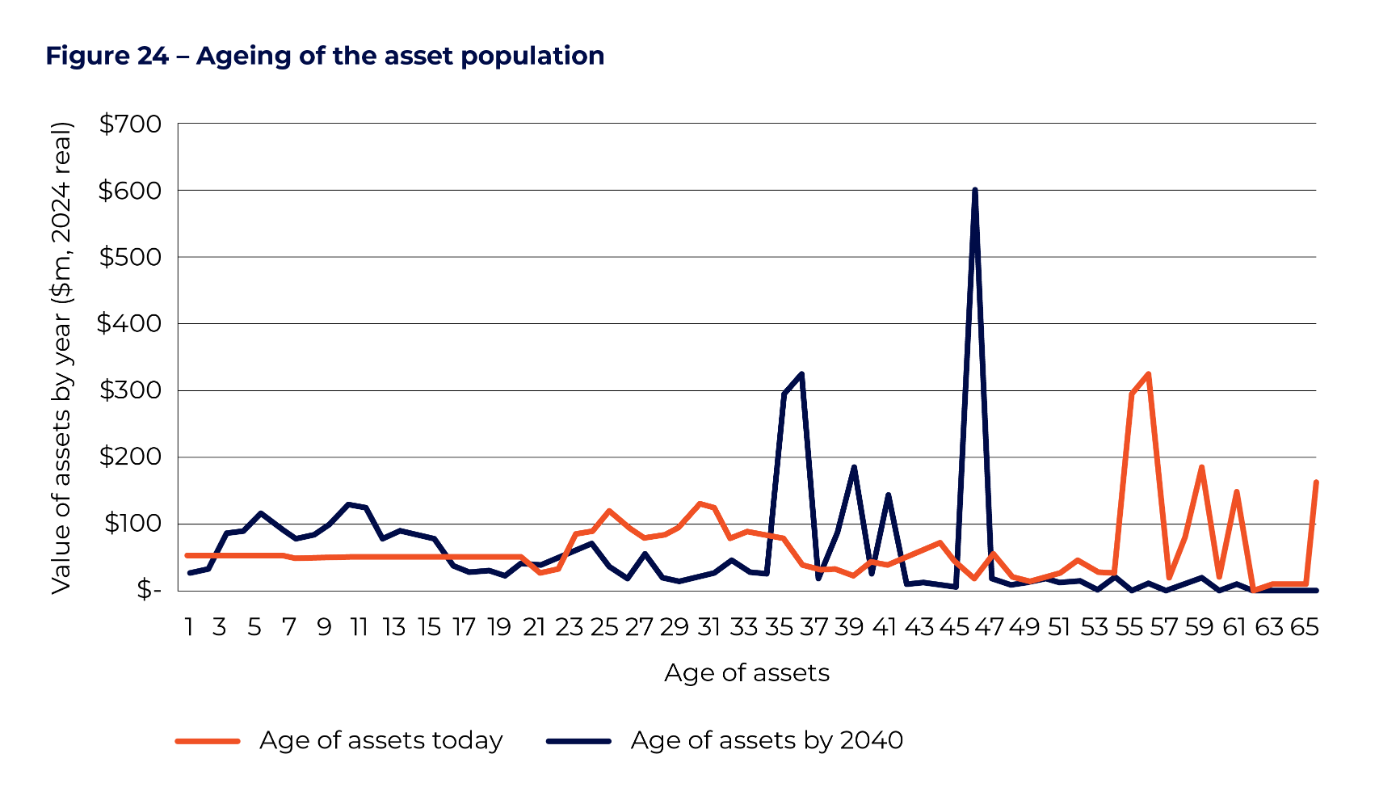
Our current replacement rate is well below a long- term sustainable rate due to most of our assets being younger than their expected manufacturing life. The dark blue line in Figure 24 shows that nearly all our network assets are under 50 years today but that a significant cohort are close to this age. This is explained by the unique circumstance in the NT where our network was re-built in a short period of time following Cyclone Tracy in 1974. The orange line shows that by 2040 a large proportion of these assets will be over 50 years by 2040 even if replacement is uplifted to $50 million per annum.
At present our strategy to manage the health of our assets has been to only replace when the asset fails in service or if the risks to safety, reliability and environment outweigh the costs. This is a strategy to ensure we maximise the full life of the asset while keeping risks within a reasonable bound.
However the rapid ageing of our cohort of Cyclone Tracy assets will require a significant uplift in our capital expenditure when the assets start to deteriorate and risks emerge. The expected scale of replacement in a short period is unique to our network given a large portion of our assets were built at the same time. A sudden rise in capital expenditure has a consequential impact on the revenue we require to fund our investments.
In our discussions with stakeholders we considered how we should approach the issue to avoid potential price shocks in the 2030 to 2040 period. The key strategies we have developed include:
- Asset management to extend asset life – The key to addressing the replacement wall is to lengthen the lives of assets so investment can be spread out over a longer period. Over the last decade, we have vastly improved our monitoring and decision-making on maintaining and replacing assets. This has helped us keep some of our assets in service longer than their technical life despite the inclement conditions on our network. We recognise that continual improvement in our asset management process such as our new risk quantification will help us better prioritise works so that we are replacing assets in order of highest risk.
- New technology and design to retire assets – New technology may provide some of the tools to help us retire rather than replace assets, keeping a lid on the replacement wave ahead. For example, we are currently looking at microgrid solutions for some parts of our remote areas rather than re-building existing infrastructure.
- Smoothing mechanisms to mitigate against price shocks – A novel mechanism suggested by our People’s Panels was a savings fund where some revenue is set aside today to pay for an expected increase in costs in the future. Our customers also considered that some replacement activity could be brought forward to minimise risks when the assets age at the same time and this would smooth out revenue over time. These programs have been included in our expenditure plans to forecast capital expenditure in Chapter Four, and revenue in Chapter Six.
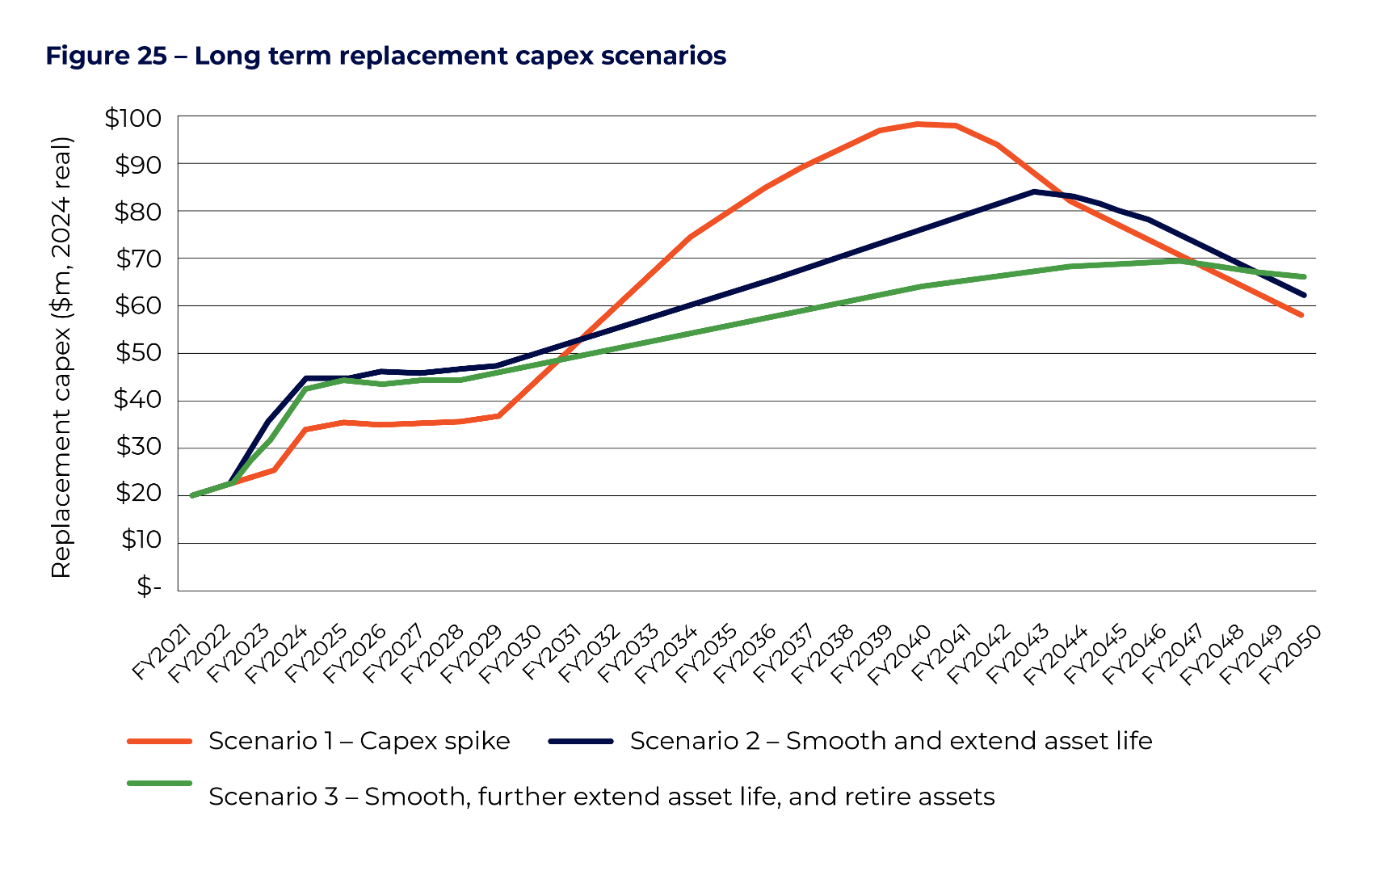
Figure 25 provides some early analysis of why this strategy can help smooth capex over time without exposing our customers to high risks. We developed three scenarios that are based on ensuring network risk levels from older assets can be managed over the next 20 to 30 years.
Scenario One is a situation where we minimise replacement to 2030. Under this scenario, we would expect to increase replacement when systematic conditions emerge in 2030-35 and accelerate replacement significantly in the 2035-40 timeframe. Based on this replacement profile, we would safely manage the reliability of the network by ensuring only 20 per cent of the total population is over the age of 50 by 2040. Under this strategy, there is a spike in capital expenditure in the 2035- 40 period of close to $500 million for replacement, which would flow onto a spike in our revenues.
Scenario Two seeks to smooth capex through spending more on replacement in the 2025 to 2035 period. While there is a significant uplift in the 2035 to 2040 period, it is less pronounced than Scenario 1. In this scenario, we would use mechanisms such as 'saving for a rainy day' fund to help keep the revenue impacts as low as possible in the period of uplift. We would also be focusing on improved asset management techniques to allow risks to be maintained at similar levels to Scenario 1 by keeping a greater proportion of older assets on the network.
Scenario Three seeks to further extend the life of assets together with a focus on retiring rather than replacing assets on the network. Under this preferred strategy, we would be able to minimise the extent of capital uplift over the next 20 to 30 years. While this is the optimal strategy it relies on technology solutions that we do not have today.
3.4 Uplifting our systems and people
Our business will need to deliver more as we transition to a network that delivers two-way renewable energy and which meets higher levels of demand for electricity in a more complex environment. At the same time, our customers are telling us that we need to maintain the affordability of our services. In this context it is vital that we invest in smarter systems and organisational change that allows us to meet new demands for our network services while keeping a lid on our costs.
In the 2019-24 period we embarked on a transformation journey that involved a new operating model and a refresh of our ageing ICT systems. It was an ambitious program and complex to implement at the speed we had intended. This was due to the difficulty of undertaking transformation when other change factors were impacting our business, including our transition to the national energy regulations and the increase in renewables on the network. The inter-related nature of the transformation program placed further challenges on developing the optimal sequence of change.
We have also prioritised our planned ICT system refresh on complying with new regulatory obligations. This includes a new meter and billing system that ensures we comply with the new NT NER rules relating to meter data, testing and validation.
Our transformation strategy going forward has been built on these learnings. The program is now planned to be completed over a longer period, consistent with the experiences of peer networks. The refresh of ICT systems will take place over a longer 10-year horizon to correspond with optimal sequencing and the key change areas of the business, including increasing renewables on the system. Chapter Four of this Draft Plan identifies the key ICT capital programs included in the 2024- 29 proposal. Chapter Five of this Draft Plan provides more information on our transformation journey in the 2019-24 period and how this is impacting our operating expenditure costs moving forward.