1. Powering the Northern Territory
We provide electricity services to more than 90 communities in the NT over a landmass of 1.3 million square kilometres. Our regulated networks in Darwin-Katherine, Alice Springs, and Tennant Creek transport electricity to 72,000 residential customers and 11,000 businesses. Each of our networks are unique, operating under different designs and environment.
The NT community is vibrant and diverse. Power and Water’s purpose is to make a difference to the lives of Territorians. This involves providing reliable electricity that promotes economic growth and contributes to our community’s aspirations.
We provide electricity, gas, water and sewerage services to townships and small communities across the NT. We have the smallest population among all Australian states and territories, but our population is dispersed over a large landmass. Our multi-utility structure is an advantage in addressing the diseconomies of scale in providing essential services to a relatively small population.
1.1 Our role in the NT regulated electricity systems
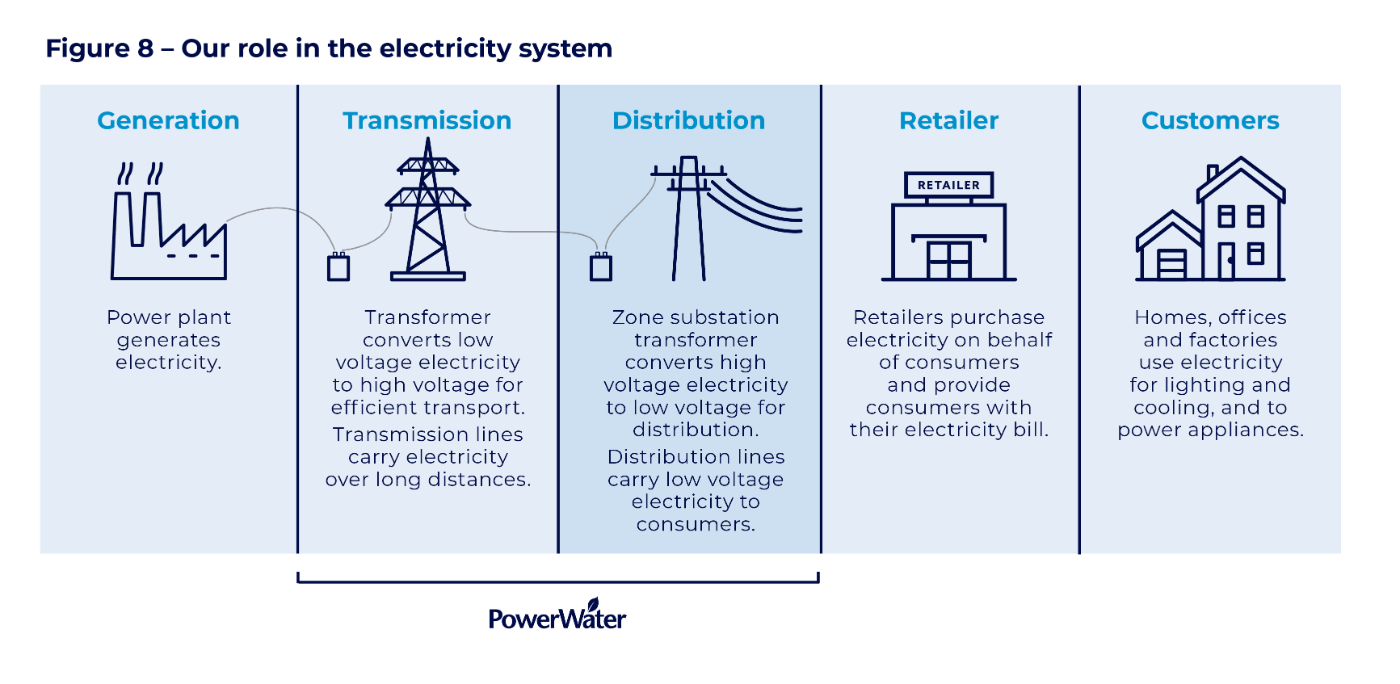
The scope of our electricity services varies across our townships and communities. In our regulated areas of Darwin-Katherine, Alice Springs and Tennant Creek, we are responsible for the transmission and distribution networks as seen in Figure 8 below. Our role is to transport electricity from generators to our residential and business customers using our poles, cables, conductors, and transformer assets. We also undertake a metering service to identify how much energy our customers have used.
Until recently, all electricity was generated at large scale power plants. Over the last decade, we have seen more of our customers produce solar and use our network to export the power to other customers. We have also seen more large scale solar farms connect to our network, a trend that will further accelerate with the NTG’s policy to have 50 per cent of electricity supplied by renewables by 2030.
The retailer has the primary relationship with customers, managing the electricity bill and organising connection. However, in many cases we also have a direct relationship with customers. For instance we provide information on network maintenance and outages, ensure energy use and billing data is correct and provide design advice on connecting to the network. We also facilitate the physical connection and have obligations to provide safe and secure electricity services. Figure 8 provides a visual of our role in the electricity sector in the NT.
1.2 Understanding what our customers want
About 72,000 households and 11,000 businesses receive power from our electricity network in the regulated regions. The power is crucial to cooling and heating homes, cooking, lighting, charging computers and mobiles, laundry and all the everyday ways we use electricity. Electricity is also a vital input for all NT businesses and a critical input for some of our larger industries.
A key feature of our engagement to date has been trying to understand how our business impacts the lives of customers. Figure 9 is the ‘Customer Lifecycle’ – our attempt to understand what customers expect and want from us across their journey as a customer. This includes when they connect, when the power is on, when power is interrupted and when power is disconnected.
Our customers have been clear on what they want from our network at each point of the lifecycle:
- Connecting – When customers are connecting to our network, they want fast and easy connection. This is a period where customers actively interact with us and want us to ensure we partner with retailers on making the process seamless.
- Connected – When customers are connected they want reliable energy at fair pricing. Customers felt that the meter reading and the billing process was vital to ensuring that bills were fair. Many of our customers also want fair rewards for contributing their solar energy to the generation mix. More generally, our customers are impacted by our regular maintenance activities including tree trimming, and want to ensure that we are taking adequate action to ensure the greenness of the streetscape.
- Outage – Customers want good communication when they experience an outage. They want to be able to contact us in ways that are convenient for them – from telephone to social media to direct notifications. Most of all they want clear information on restoration times. Finally customers want us to take care when we need to enter their property to fix an outage.
- Disconnected – Customers who wanted to move out indicated that prompt timing and reconnection were vital to their experiences. There was also a want for accurate metering reads, and prompt billing at the end of disconnection.
In Chapter Two, we discuss the current pain points our customers experienced across the lifecycle, and how we engaged with customers on these issues. This included the impact of our tree trimming on the street landscape, the meter and billing process, and our role in providing objective information to customers about broader electricity issues such as connection of solar panels.
Figure 9 – The Customer Lifecycle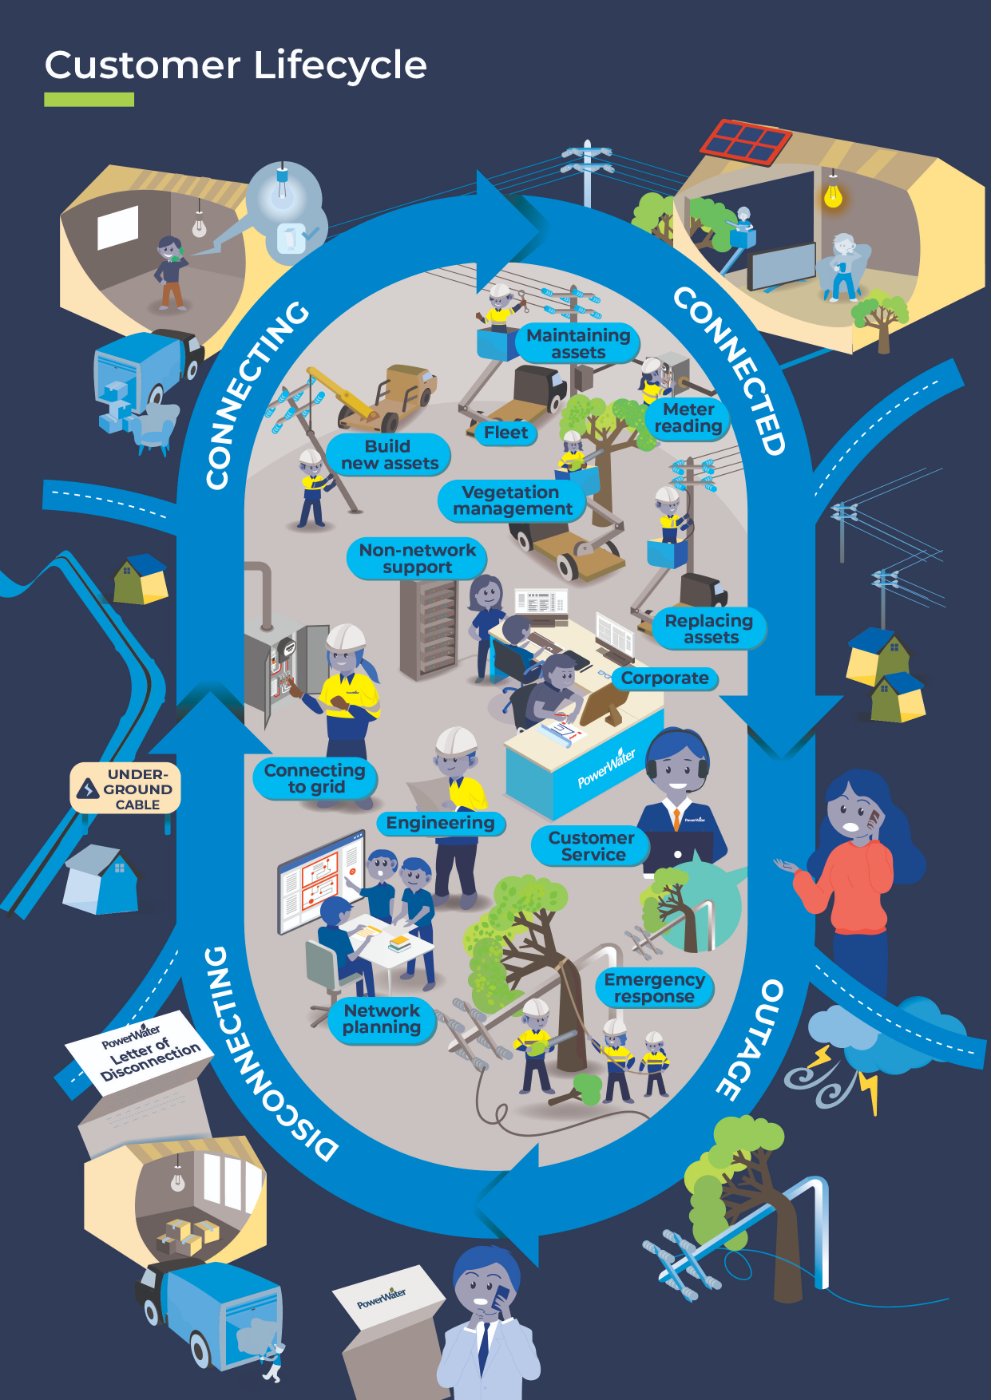
1.3 Energy affordability is an issue in the NT
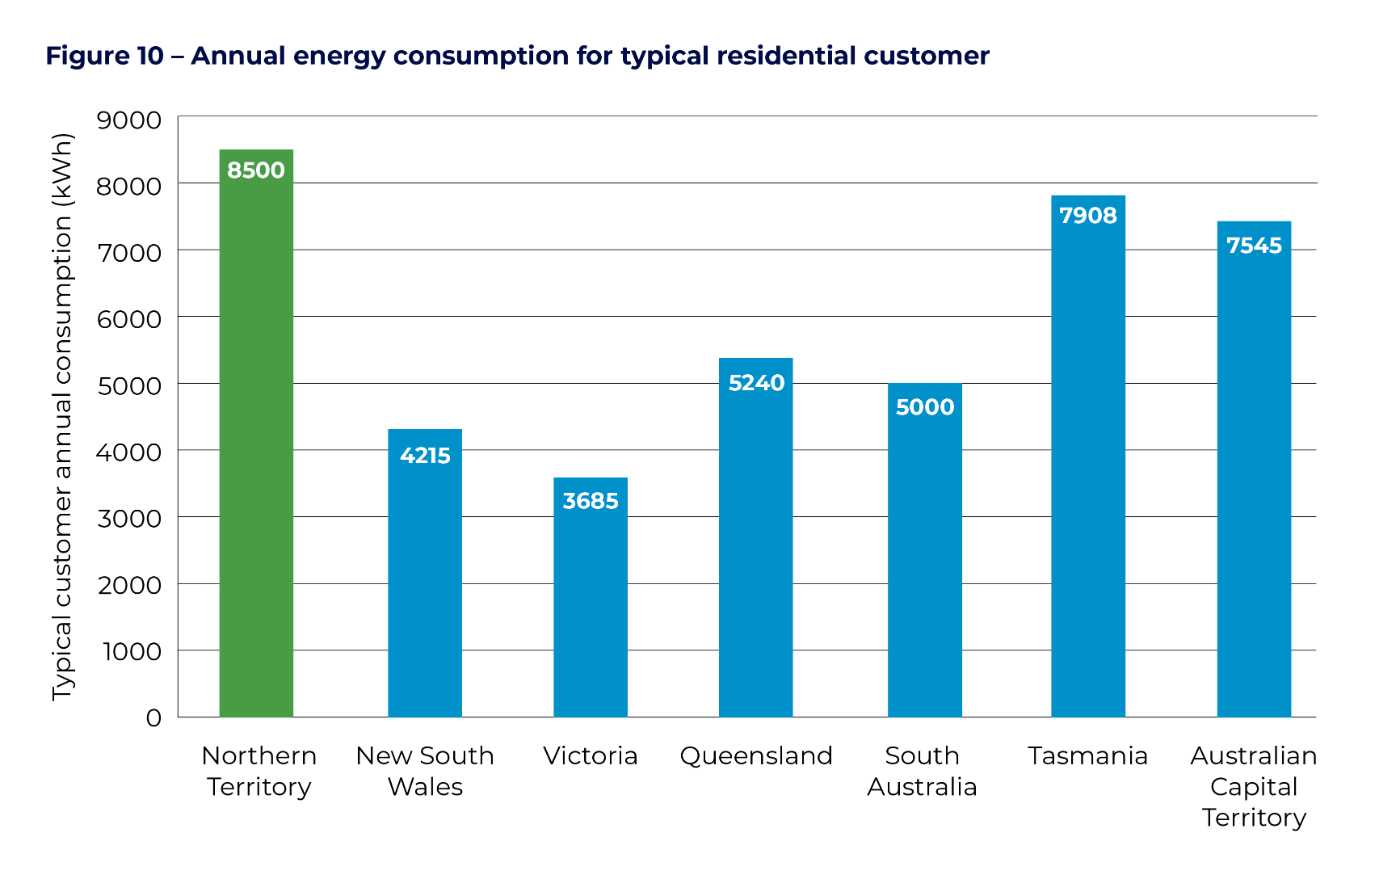
The extreme heat in the NT means we are far more reliant on cooling than other places in Australia. A typical household consumes about 8500 kWh of energy each year, almost double the consumption of a typical NSW household as seen in Figure 10. This means that electricity bills comprise a larger portion of disposable income compared to the national average.
The extreme heat in the NT means we are far more reliant on cooling than other places in Australia. A typical household consumes about 8500 kWh of energy each year, almost double the consumption of a typical NSW household as seen in Figure 10. This means that electricity bills comprise a larger portion of disposable income compared to the national average.
In our engagement sessions, customers told us we need to be more proactive in improving energy affordability of low income households. A key concern was energy efficiency, with low income households tending to live in old housing that requires significantly more cooling due to insulation issues. Low income households are also generally renters, with the NT having the highest number of renters per capita in Australia. This means that the existing cooling appliances tend to be inefficient, leading to higher costs of energy compared to the average household.
Key measures to improve energy efficiency include better insulation in the ceilings, windows and floors. Replacing older cooling appliances with newer models is also likely to lower the amount of energy consumed. We see a role for positive incentives to encourage these initiatives.
A key issue we seek to explore with our stakeholders is the role we should play in improving the energy efficiency of customers. Should we lead the conversation, provide more information on our website, or should we implement our own initiatives which are then funded by all customers?
1.4 Our activities and services
In our engagement sessions, customers wanted to know how our activities fit into their experience with our network. We used a framework that mapped our activities to the customer lifecycle described in section 1.2.
Figure 11 shows our electricity network and support activities align to one or more of the phases of the customer’s journey
- In the connecting phase, we build new assets to meet demand from residential and commercial developments, and work with our retailers to connect new customers to the grid. This includes installing new meters when a new customer connects to the network
- We keep customers securely and reliably connected to our network by maintaining and replacing our network assets. We also undertake vegetation management to ensure our electrical assets do not contact trees and shrubbery. Finally, we read meters to ensure customers receive an accurate bill for the energy they have consumed.
- Our customers experience an outage when there is scheduled maintenance or due to unplanned events such as extreme weather or an asset failure. When there is an unplanned outage, we undertake emergency repairs such as during Cyclone Marcus in 2018. We also use our customer service team and rely on our ICT systems to notify customers of restoration times.
- We disconnect customers when requested. Our role is to work with the customer's retailer and to ensure a final and accurate meter read for the last bill.
There are also many core activities we perform across the customer's lifecycle. Our network planning team are monitoring the health of our assets and identifying emerging needs. This activity is important for maintaining the reliability, safety and security of the network. Our non- network activities are directed at ensuring we have the necessary ICT, property and fleet support to perform our network activities. Like any business, we also need to perform corporate activities such as finance, legal, procurement and human resources support.
The AER classifies our activities into services. This is to ensure that the regulatory processes focus on parts of our business where we are a monopoly or dominant provider, and does not unnecessarily regulate a market where there is sufficient competition. In the 2019-24 determination, the AER classified our services into three broad categories.
Services are classified as standard control if there is no prospect of competition. The AER set a revenue cap for these services based on financing and operating costs. The transportation of energy through our network to our customers is a standard service which is recovered through our network tariffs from a customer's retailer. We discuss our plans for standard control services in Chapters Four, Five and Six.
Alternative services relate to one-off services for an individual customer, or services where there is the prospect of competition. Alternative services are paid for directly by the person or entity receiving the service. This includes our metering services which is discussed in Chapter Seven.
Unclassified services relate to areas of the business where there is sufficient competition in the market.
The AER recently published a preliminary position paper on changes to the classification of services for Power and Water, following a submission we provided. In the paper, the AER noted the changing nature of the energy market and the possibility of new emerging services. The AER also recognised the importance of a customer's connection and ability to export their energy to the network.
Figure 11 - Power and Water activities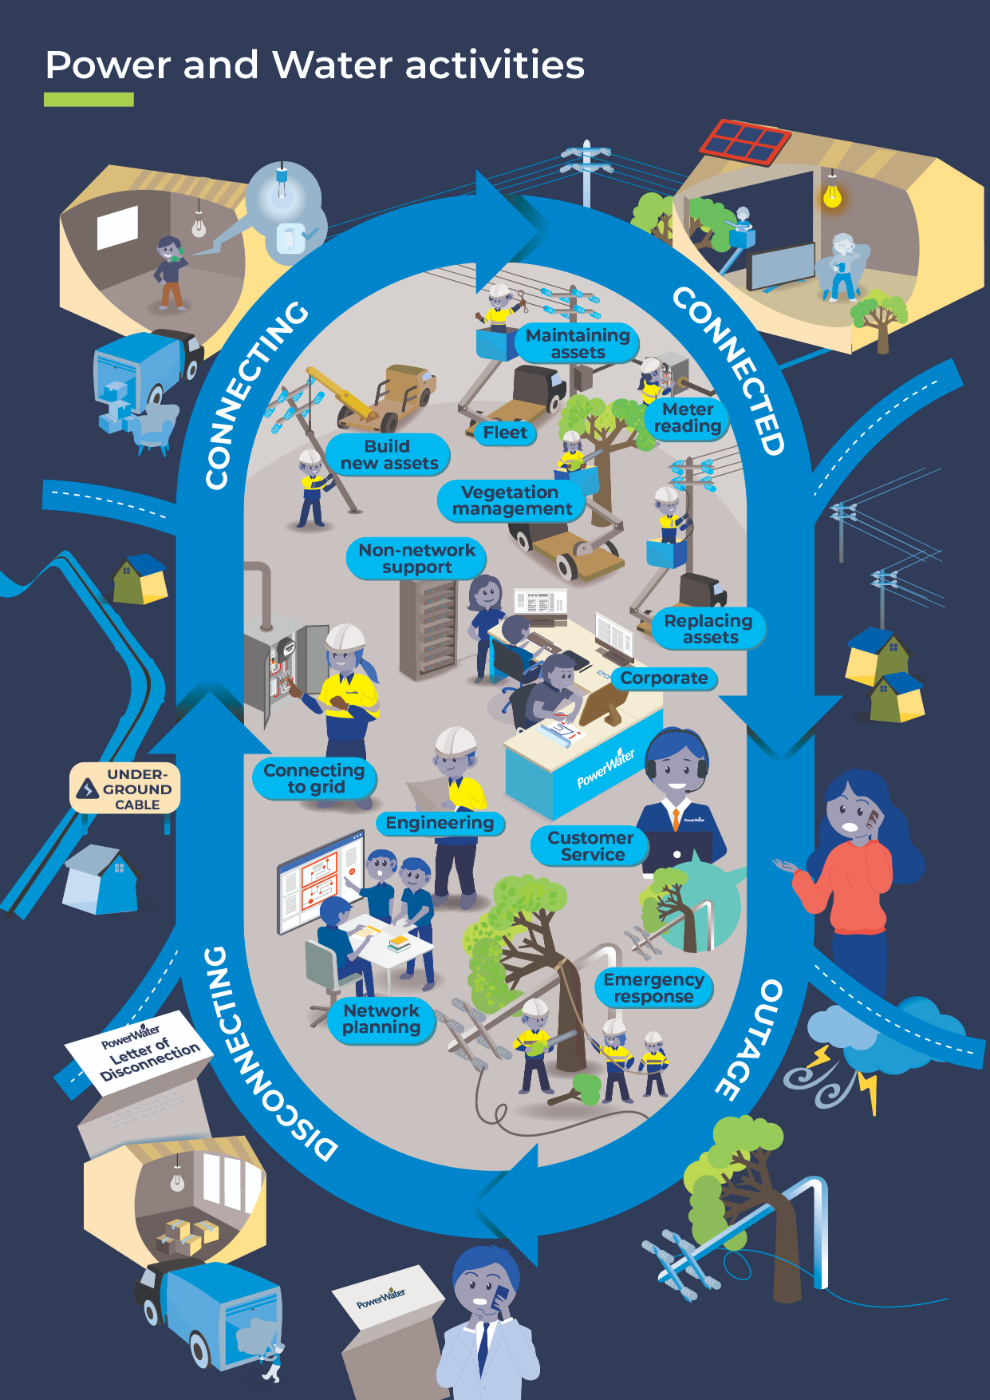
1.5 Our costs
Figure 12 shows the relative contribution of activities to total network costs over the last decade and the type of costs we incur.
Capital expenditure relates to building or replacing assets that provide services over a longer period. This includes replacing network assets, building new network assets and connecting customers to the network. Capital expenditure is recovered over the expected life of an asset.
Operating expenditure relates to regular annual expenses such as maintaining assets, vegetation management and emergency response to outages. These costs are recovered on a yearly basis.
Some activities have a mix of operating and capital expenditure. Like other businesses, we have Information, Communication and Technology (ICT), property and fleet assets to support our network activities. Some of these costs relate to assets such as hardware, while others relate to regular expenditure such as ICT support. We also invest in new meters and incur operating expenditure to manage our metering functions.
Network and corporate overheads support our network services. Network overheads include asset management activities we undertake to plan, control and manage the network. Corporate overheads including finance, legal, procurement and human resources to support activities across our electricity, water, sewerage and gas lines of business. We allocate overheads to each line of business in accordance with our Cost Allocation Methodology. We also allocate these costs to capital and operating expenditure depending on the nature of the activity.
Our network has many unique characteristics that impact on our relative costs compared to our peers.
Small scale
We have the smallest electricity network compared to other networks in the National Electricity Market on measures such as customers, energy volumes and peak demand. At the same time, our network is relatively spread out meaning we need to build more network to meet the demands of each customer. We also must meet the same regulatory obligations as larger networks but have to spread the costs over less customers.
Transmission network
Together with Tasmania, we are the only business in Australia that has complete carriage of transmission and distribution functions. Our transmission network in Darwin-Katherine and Alice Springs is extensive with about 400 kilometres of transmission line, 3000 towers and four sub-transmission substations. Being a transmission operator also means we need to ensure that large scale generators can connect safely to our network.
Extreme weather
We operate in extreme environments particularly in Darwin which has high humidity in the wet season and is prone to destructive cyclones and tropical storms. We also have extreme heat compared to other places in Australia. These conditions tend to increase our emergency management costs compared to other networks and can lead to more wear and tear of our network assets.
Weather also impacts on labour productivity in humid weather, with our field crews productivity impacted by the extreme conditions.
Unique regulations
Like all other networks, we have licence and reporting obligations and must comply with environmental regulations. We also have unique obligations that impact our costs including traversing sensitive environmental areas. This requires mitigation practices which increases time and cost to undertake network activities. Further, the Northern Territory has many sites of cultural significance and all programs of work need to assess and mitigate against adverse cultural heritage impacts leading to additional costs.
Figure 12 – Types of costs over the last decade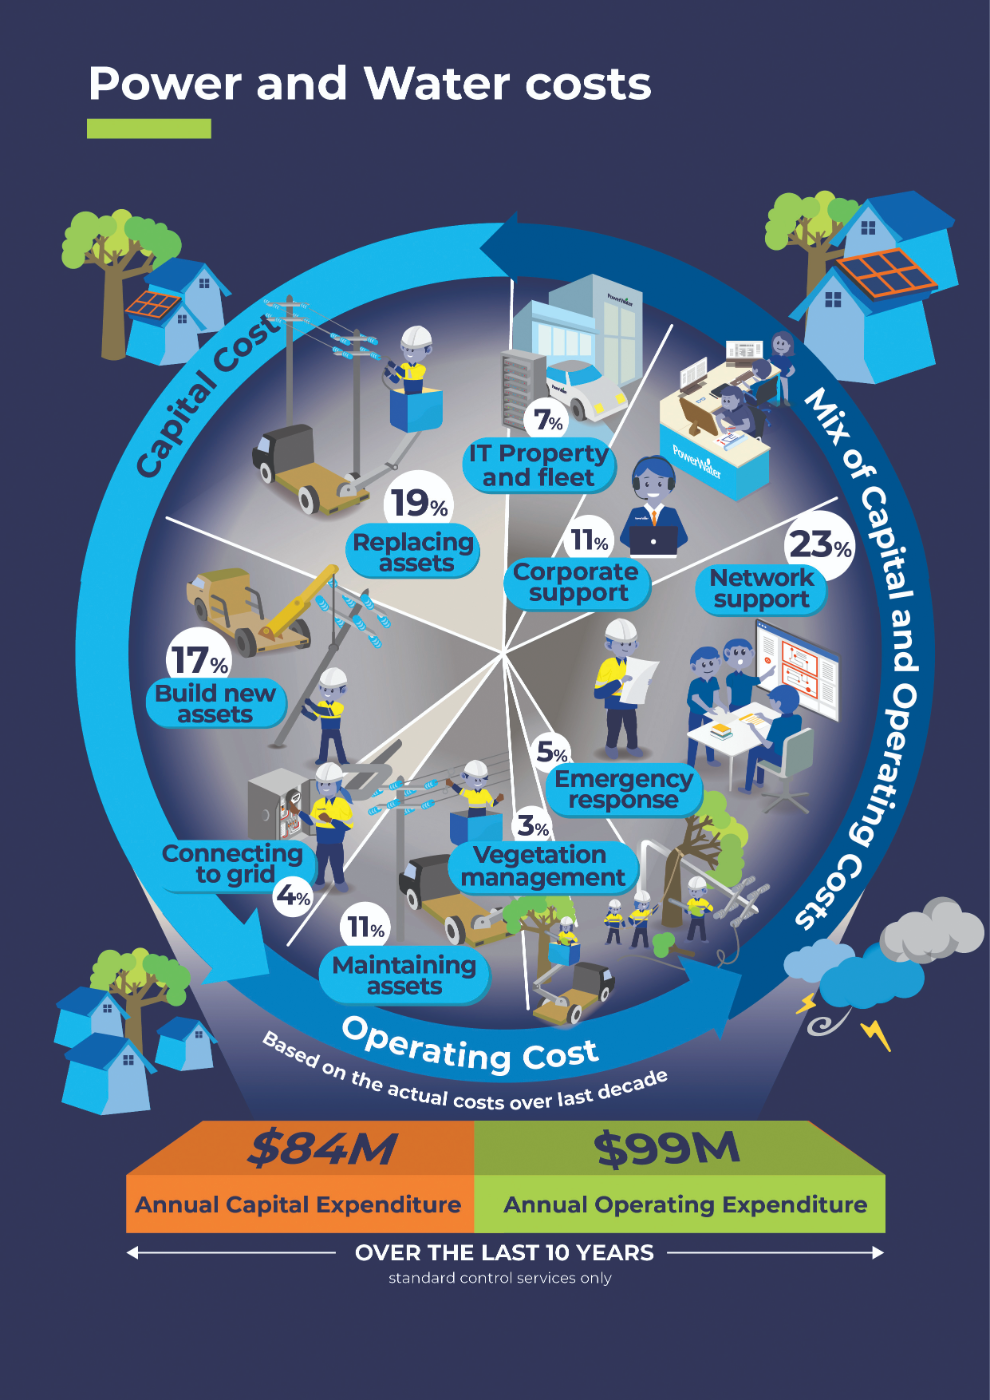
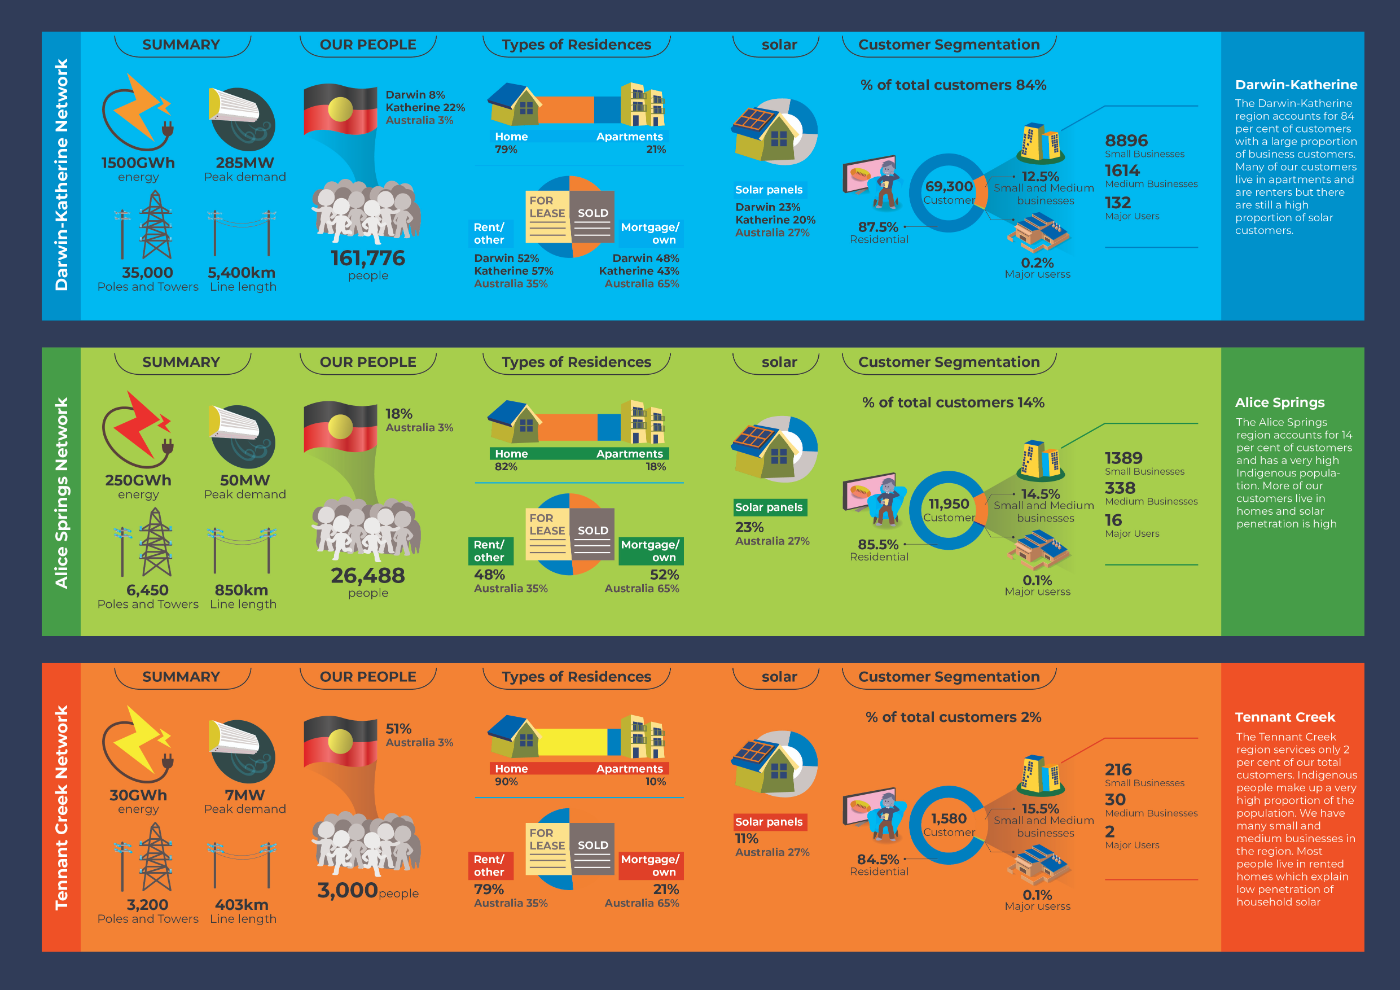
1.6 Our networks and customers in the three regions
In our consultations with customers, a key message was that each region has its own circumstances and that our decisions should reflect and adapt to meeting the needs of different customers.
We also discussed how each of our regions have a unique network design and environment, and how that impacts our decisions. For example, the assets in Darwin are prone to cyclones and extreme events, while assets in Alice Springs face salinity issues due to the water table. Our customers wanted to understand these differences and how we make decisions in the interests of all customers.
Figure 13 shows the differences between each region in terms of the network and the socio- demographic characteristics. This is discussed further in the sections below.
Darwin-Katherine
The Darwin-Katherine electricity system is a stand- alone power system that provides power to 150,000 people and 8,200 businesses in Greater Darwin and outer suburbs. The system also provides power to 16,000 people and 800 businesses in Katherine. It is our largest electricity network in the NT, accounting for 83 per cent of energy consumption across the three regulated regions.
The Darwin-Katherine electricity system is predominantly powered by gas turbines south of Darwin. In recent times we have seen more large- scale solar enter the energy system and we expect this to accelerate significantly over the next decade in combination with storage to produce 35 per cent of all electricity in the region. In addition to large scale generation, about 10 per cent of electricity production comes from rooftop solar owned by our customers. This is expected to increase to 15 per cent by 2030.
Our transmission network transports electricity north to Darwin and surrounding regions. The Darwin-Katherine transmission line also brings power to customers all the way south to Katherine through Manton, Pine Creek and Batchelor. The transmission network includes 400 kilometres of line and 2,700 towers. Our distribution network is extensive with more than 5,000 kilometres of lines, 32,000 poles, 3,000 transmission towers and 3 zone substations.
Alice Springs
The Alice Springs electricity system is significantly smaller and less complex than the Darwin- Katherine network. It provides power to 26,500 people and 1,750 businesses. It accounts for about 15 per cent of energy consumption across the three regulated regions.
Electricity power is predominantly generated by a large-scale gas turbine south of the main population area. The NTG has a policy to increase renewables to 50 per cent of all energy consumed by 2030. About 20 per cent of our customers have solar panels accounting for about seven per cent of energy production. There is also some large-scale renewables connected to the grid accounting for about four per cent of energy produced.
About 30 kilometres of transmission line transports the power to our zone substations. The distribution network comprises about 850 kilometres of electricity lines and 6,500 poles.
Tennant Creek
The Tennant Creek electricity system is the smallest of our regulated networks. It provides power to 3,000 people and 250 businesses. It accounts for only two per cent of total energy consumption across our three regulated regions.
Electricity is generated by the Tennant Creek Power station and transported to the zone substation. The distance of the network is relatively large for the customer base comprising 400 kilometres of lines and 3,200 poles, reflecting the rural location.
Figure 13 – Comparison of key networks